|
|
|
|
|
|
Modelling Cycling
 These days I do just as much cycling as I do rowing and sculling. Naturally I am just as curious about what "matters" in making bikes go fast as I am in rowing. A short while ago I came across a paper, "Validation of a Mathematical Model for Road Cycling Power", JC Martin et al, 1998 (I can't find a direct link to it but search for it and you should find it fairly easily) which describes and validates a mathematical model of cycling, taking into account all the sources of energy loss a cyclist's power needs to overcome. With the model, one can estimate quite accurately how a cyclist should perform over a known course, or address many of the common questions and received wisdoms in cycling. Like any performance-endurance sport, such as running, rowing and cross-country skiing, cycling is first and foremost all about power. Other things being equal, an athlete with more power will beat an athlete with less. Power, in Watts, is the amount of energy, in Joules, produced in one second. To provide some context, Bradley Wiggins can apparently produce something around 500 Watts over a 10-mile time trial, or 400+ Watts up the final climb of a big mountain stage. An average male club cyclist perhaps around 250W, female maybe 170W. Anyway, given a knowledge of likely power output for a certain time, and certain other inputs like rider and bike weight, total presented frontal area, drag coefficient, coefficient of rolling resistance, air temp, pressure, etc (all of which can easily be found on the web or measured), one can get good answers to questions like: - How fast should I go at, say, 275W? - How fast would I go into a 15mph headwind, or up (or down) a 10% gradient? - How much faster should I go if I changed position to reduce my frontal area? Or, given a whole time-trial course map and gradient profile (which I've actually done for Richmond Park, see below): - How much difference would 10W power increase make to my total time? - How much faster would I be if I had a 200g (7oz) lighter bike? - How fast should I expect to be going at any given point on the course? - What difference does a 5mph SW wind make, as opposed to a 10mph N wind? - If I can produce a certain average power over a course, should I work harder up the climbs or harder on the flats? - How much difference should a time-trial bike and position make? In the articles elsewhere on this page now and in future, I'll try to answer these and more questions. |
||||||||||||||||||||||||||||||||||||||||||||||||||||||||||||||||||||||||||||||||||||||||||||||||||||||||||||||||||||||||||||||||||||||||||||||||||||||||||||||||||||||||||||||||||||||||||||||||||||||||||||||||||||||||||||||||||||||||||||||||||||||||||||||||||||||||||||||||||||||||||||||||||||||||||||||||||||||||||||||||||||||||||||||||||||||||||||||||||||||||||||||||||||||||||||||||||||||||||||||||||||||||||||||||||||||||||||||||||||||||||||||||||||||||||||||||||||||||||||||||||||||||||||||||||||||||||||||||||||||||||||||||||
|
How to Clean a Bicycle Chain (and Why)
=>  =>
=>
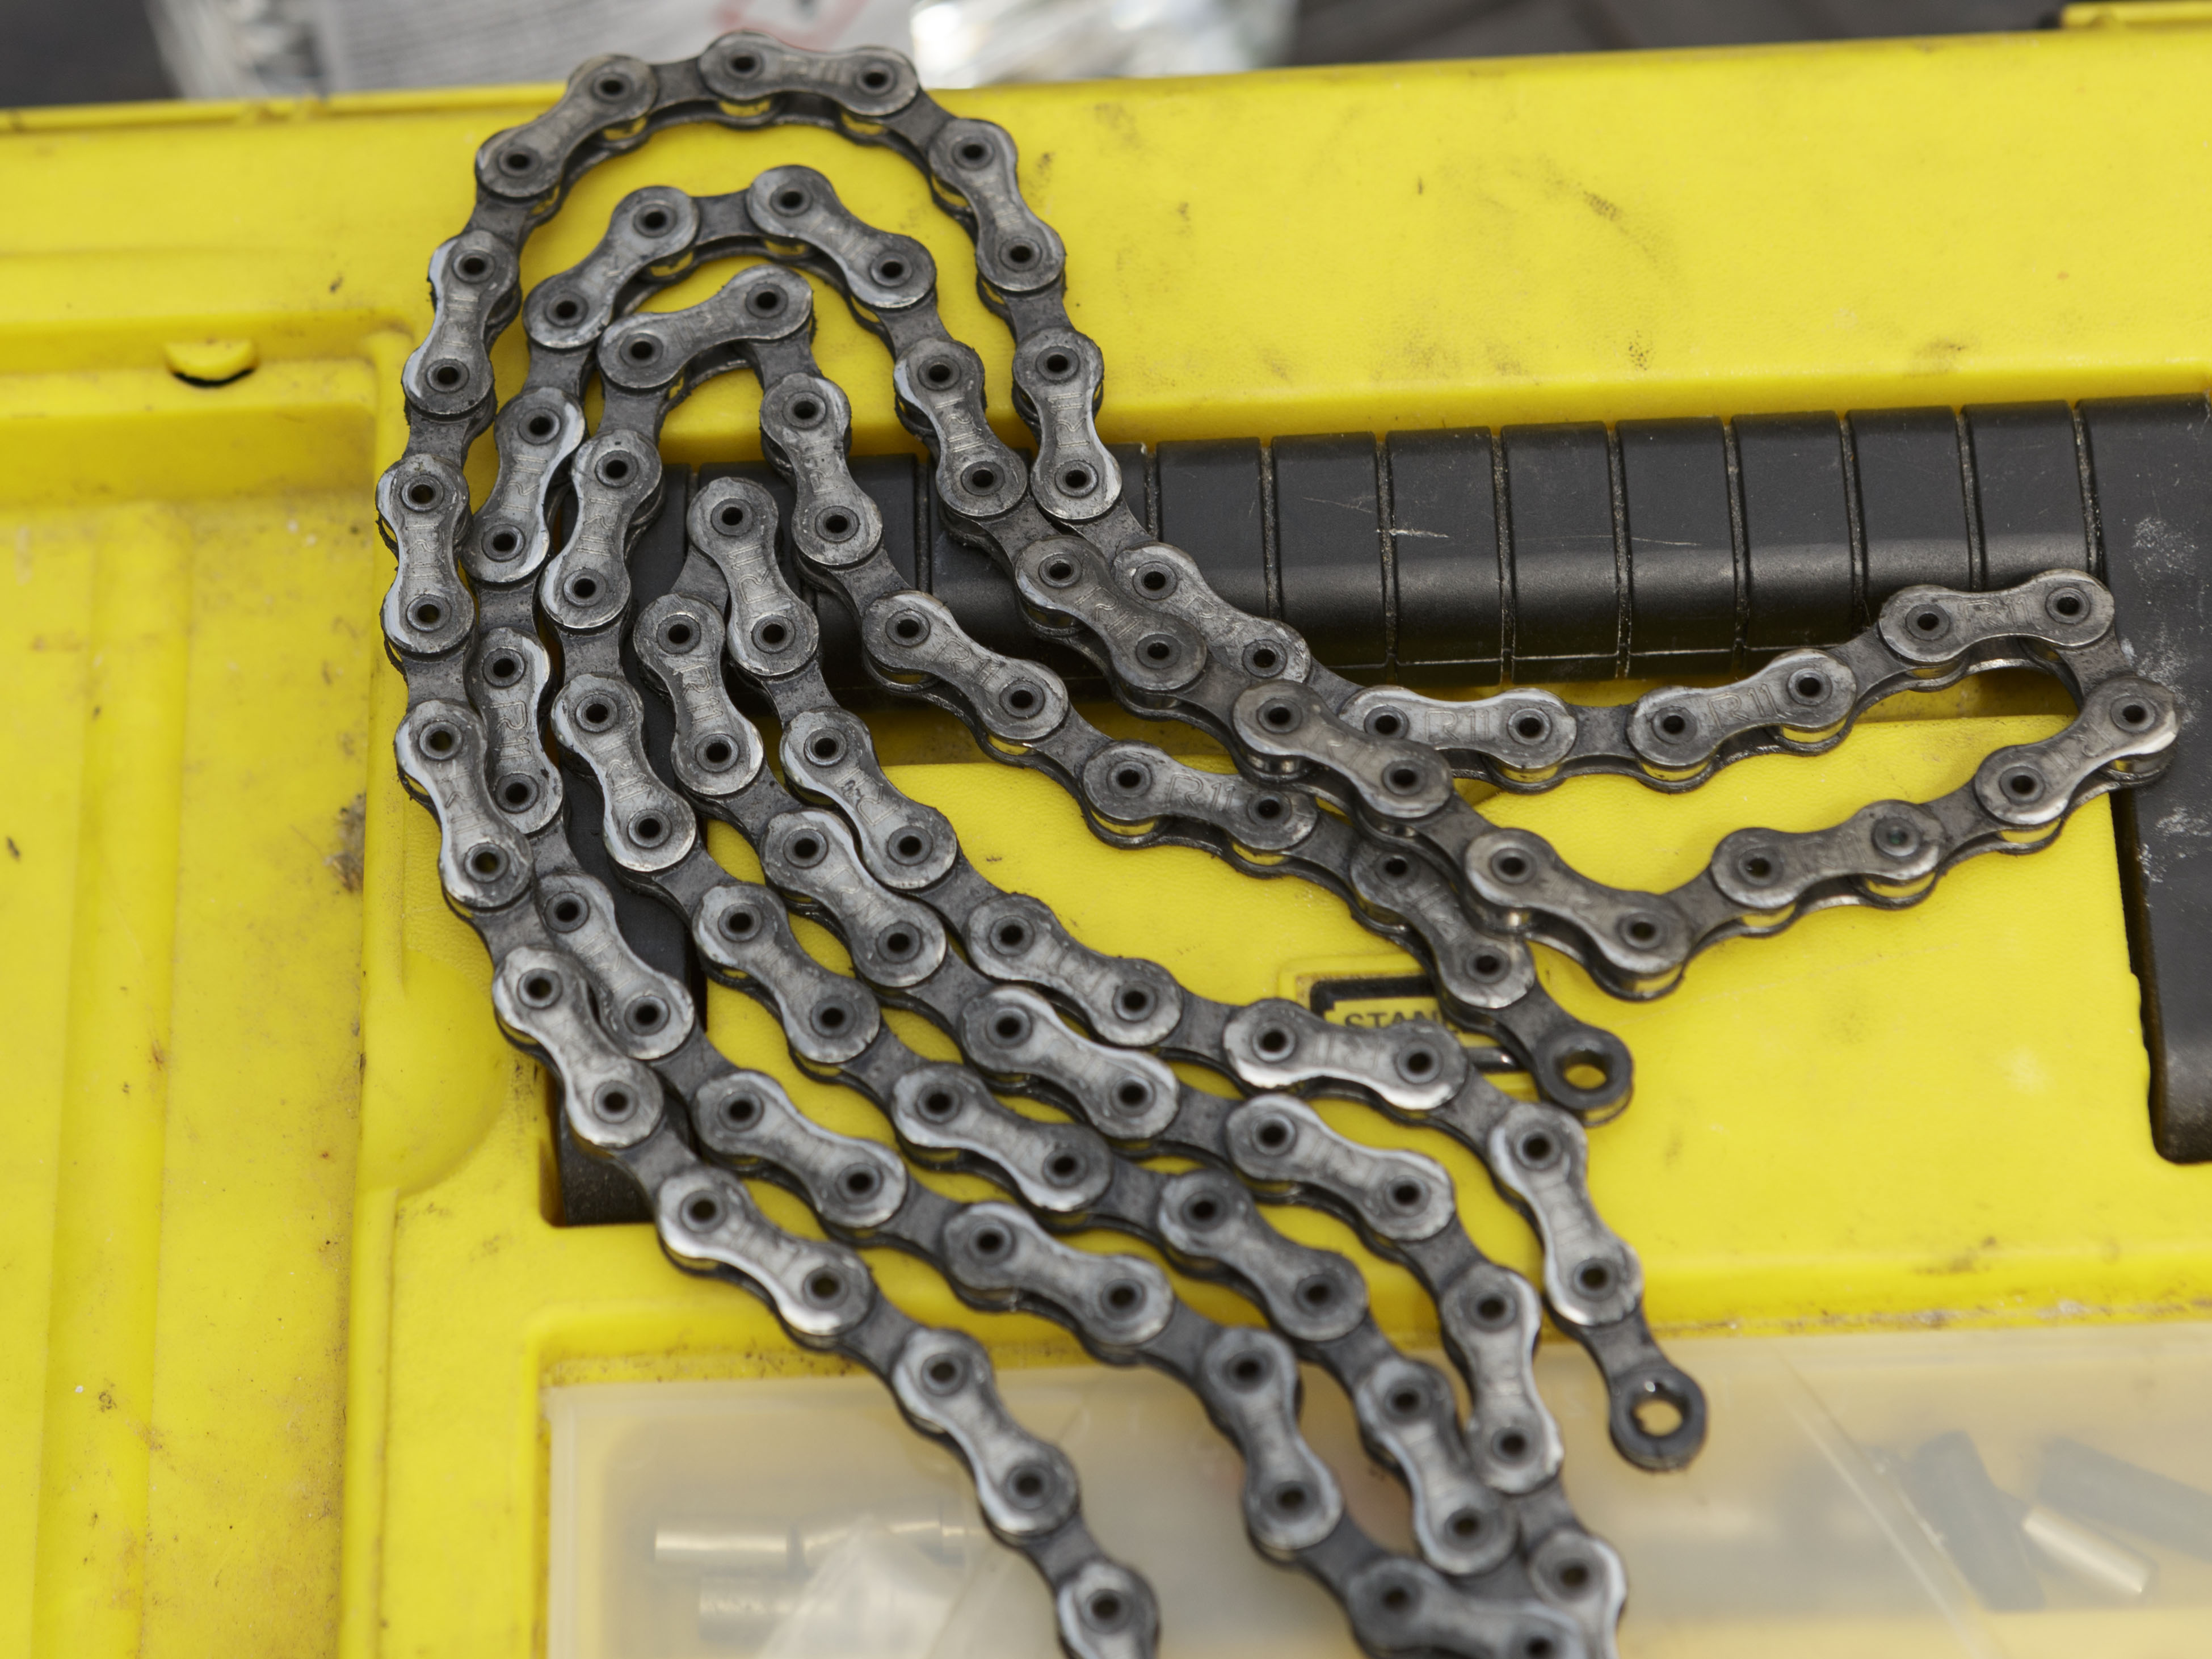
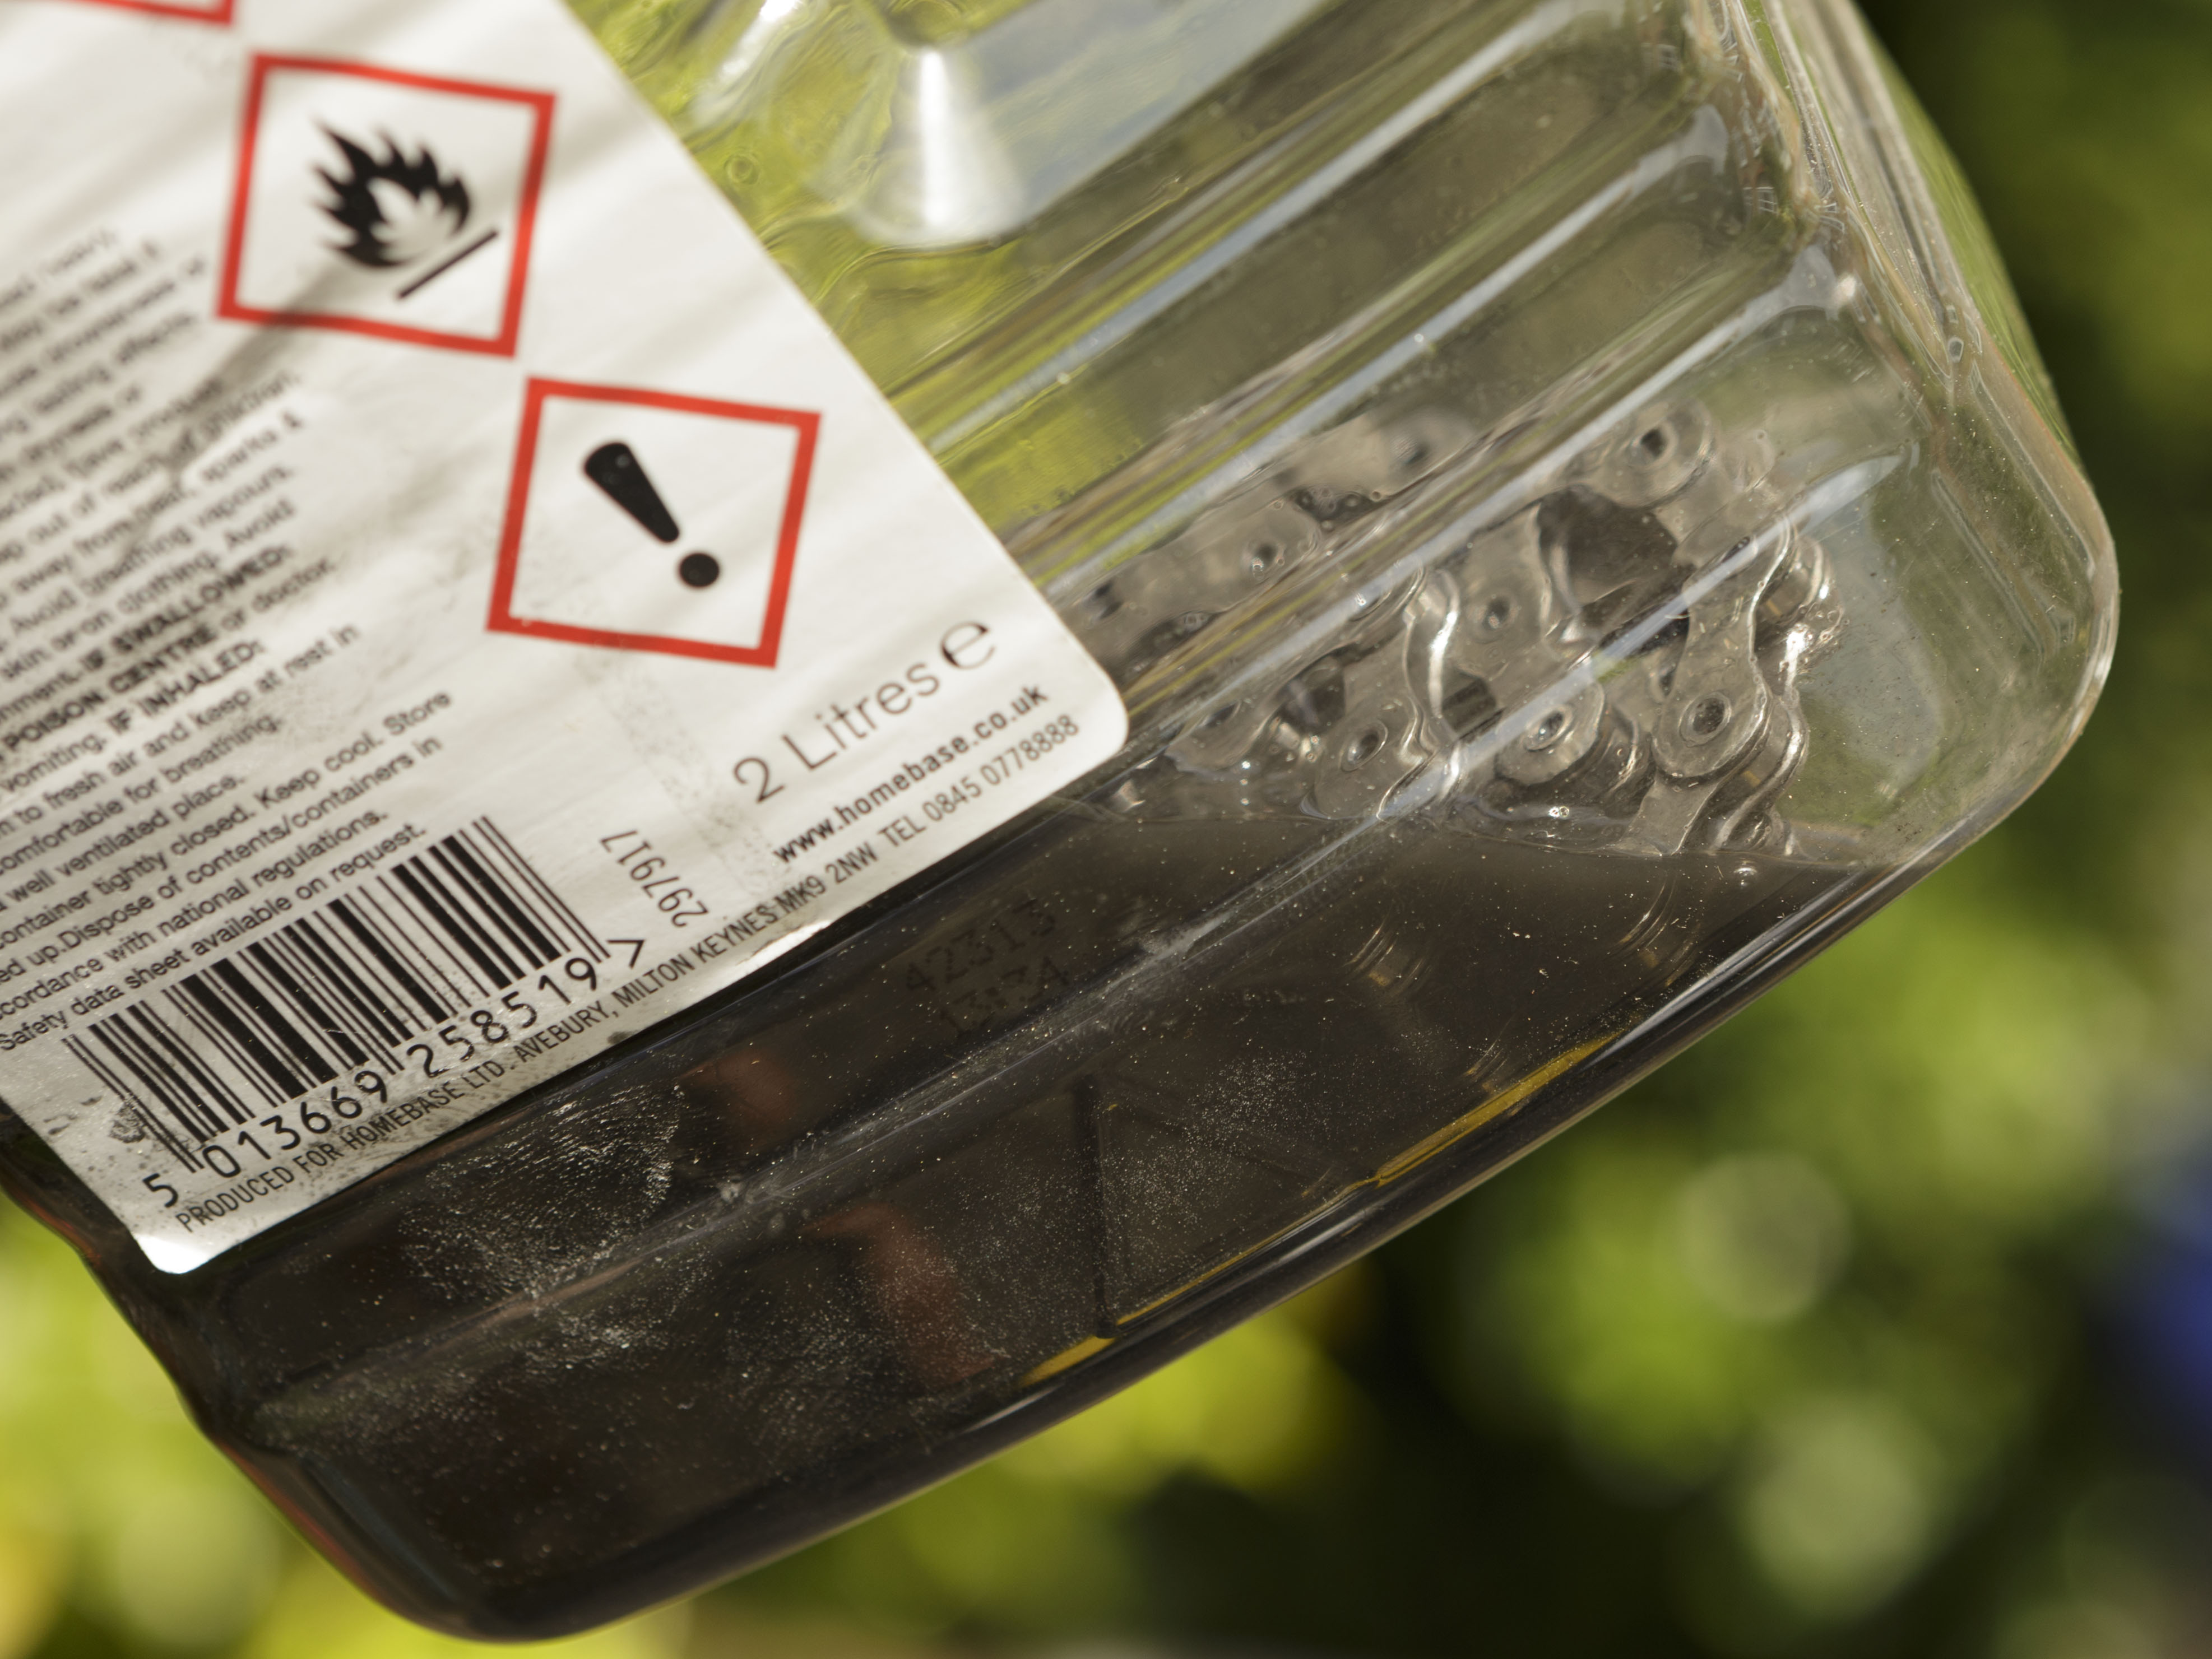
I�ve been cycling almost every working day plus a few weekends for 25 years, partly to get to and from work, but also to supplement my rowing training. One thing which I�ve never really got to grips with and solved to my satisfaction, until now, has been �blackstuff� build-up, drivetrain-wear, cleaning and re-lubrication, i.e. chain, sprockets and d�railleurs. After years of not really thinking about it and loyally replacing worn chain and sprockets every 6 months, it suddenly became an obsession. There must be a �best� way of cleaning a chain and keeping it clean. As an engineer by training and with a penchant for all things mechanical and getting my hands dirty, it�s amazed me that a �perfect way to clean the chain� is not standard lore and well known by everyone. Indeed, it seems to be one of those subjects that arouses almost religious zealotry, yet almost nobody gets it right. Commercial Cleaning Kits You can buy drivetrain-cleaning kits, usually a chamber containing brushes and scrapers which you fill with degreaser and that gets clipped around the chain, which you then pull through. The idea is that the grit and grease get dissolved, scraped off, lifted and removed, and afterwards the chain gets wiped clean and re-lubed, and you�re ready to go. I�ve used this method a few times, and it�s true it looks impressively cleaner afterwards. However I know of a few articles that question this method (see Jobst Brandt's). They say that although the chain looks cleaner, it�s only cosmetic, and in fact the kit-method actually makes things worse, and thereafter wear-rates will actually accelerate. I agree with them. One of the biggest problems is that to be cleaned properly, the chain needs to be cleaned on the inside, where the wear-contact actually takes place. I have developed a way to do this conveniently, but it does require the easy removal and re-installation of the chain from and to the bike. Why Bother? Before talking about how to clean the chain, it�s worth talking about why one should clean the chain, how does a chain get dirty and why does it matter? The short answer is that the black stuff is a mixture of metal wear-particles, ground-up road grit and lubricant. This acts as a grinding-paste that wears away at the chain and sprocket-teeth, eventually causing the chain to skip and fail to change gear properly. Keeping it all clean and well-lubricated delays this process and looks better! A chain gets dirty in two main ways: 1. Metal Wear. The �black stuff� that appears pretty quickly - with me, it�s evident after only 20 miles of dry riding! - is a suspension of microscopic metal wear-particles in chain lube, caused by pin-on-sidewall wear and (later on) pin-on-tooth wear. Pin-on-sidewall wear causes the pin and the sidewall-holes to become oval-shaped, in turn causing the pitch (link-to-link distance) of the chain to increase. This also increases the overall length of the chain. The increase in pitch causes the chain to start to progressively sit further up the �slopes� of the sprocket teeth and concentrates all the stress on just one tooth/pin at a time (instead of spreading it across many), in the process scraping off a slough of tooth-material. Both these processes produce millions of tiny particles of metal which get suspended in the lubricant and colour it black. 2. Wet riding throws up road grit in the water spray onto the chain, where it gets ground up. This ground grit, when mixed with lubricant and water, creates a perfect grinding arrangement. In the dry the resulting paste is thick, sticky and quickly gets moved aside, forming �drifts� of sticky paste on e.g. the inner chain plates. Actually the visible stuff is mostly residing out of harm�s way. However in the wet the constant re-introduction of water and new grit allows lots of �paste movement� and a constant source of grinding solution to the tooth/chain interface, meaning highly accelerated wear rates in the wet. Furthermore, the water allows the paste to move into the internals of the chain, further accelerating wear. The visible sticky black stuff is not really harmful, just ugly. The harmful stuff is the grinding particles inside the chain where it�s enclosed and has nowhere else to go and where it continues to cause wear even in the dry. The purpose of cleaning a chain is to try to get rid of the stuff inside. However, cruelly and ironically, most chain-cleaning processes and gadgets actually do the exact opposite: they just scrape off the ugly (but harmless) stuff and introduce MORE grinding-paste to the internals. Think about it - the whole area gets flooded in degreaser and/or new lubricant. This creates an environment very similar to wet riding, dissolving and lifting the black hard-pack back into a rich particle-suspension and flooding the internals with new grinding paste. The end result will be a cosmetically clean-looking chain, but a chain in far worse state from a potential wear viewpoint than before! Your �clean� chain will now wear much faster than it would have done had you not �cleaned� it! Even just re-lubing a dirty chain will also have the same effect: the oil and its solvent carrier will simply release and carry more wear-particles into the chain�s innards. So unfortunately, chains kept clean and/or lubricated in the most common ways and even using commercial kits will see their wear-rates accelerate as they get older, even though they may still look pretty and clean. How to Clean the Chain As I mentioned before, the primary goal should be to clear the chain�s internals of particles. The only way to do this properly involves removing the chain easily and conveniently without damaging it. Using a pin-pushing tool is NOT the way, eventually you�ll damage a sidewall and you�ll see your chain lying on the road shortly thereafter, if not you with it. I use a KMC �Missing Link�, actually a Campagnolo-10 version (re-usable) on my Campagnolo-11 set-up (it works fine). I can get this whole process done in less than 30 minutes. You Will Need: -- 2 largeish white spirit (US: mineral spirit) bottles, 2 litre perhaps, each with 1-2 inches of white spirit. 2nd bottle should be cleaner white spirit than the first. -- A reasonably leak-proof tub (for soaking and degreasing cassette and sprockets) -- Ultrasonic Cleaner, ideally ~2 litre capacity and 100-150W or greater. Maplin do a 170W 2.5 litre one for �99.99. -- Tools: cassette removal tools; spare spoke (for fishing chain from bottle); Step By Step -- Drop the chain into the first bottle, put the top back on, vigorously shake for a minute or so. (click the image for a hi-res version to appear in a new tab. click again to reach full-res)
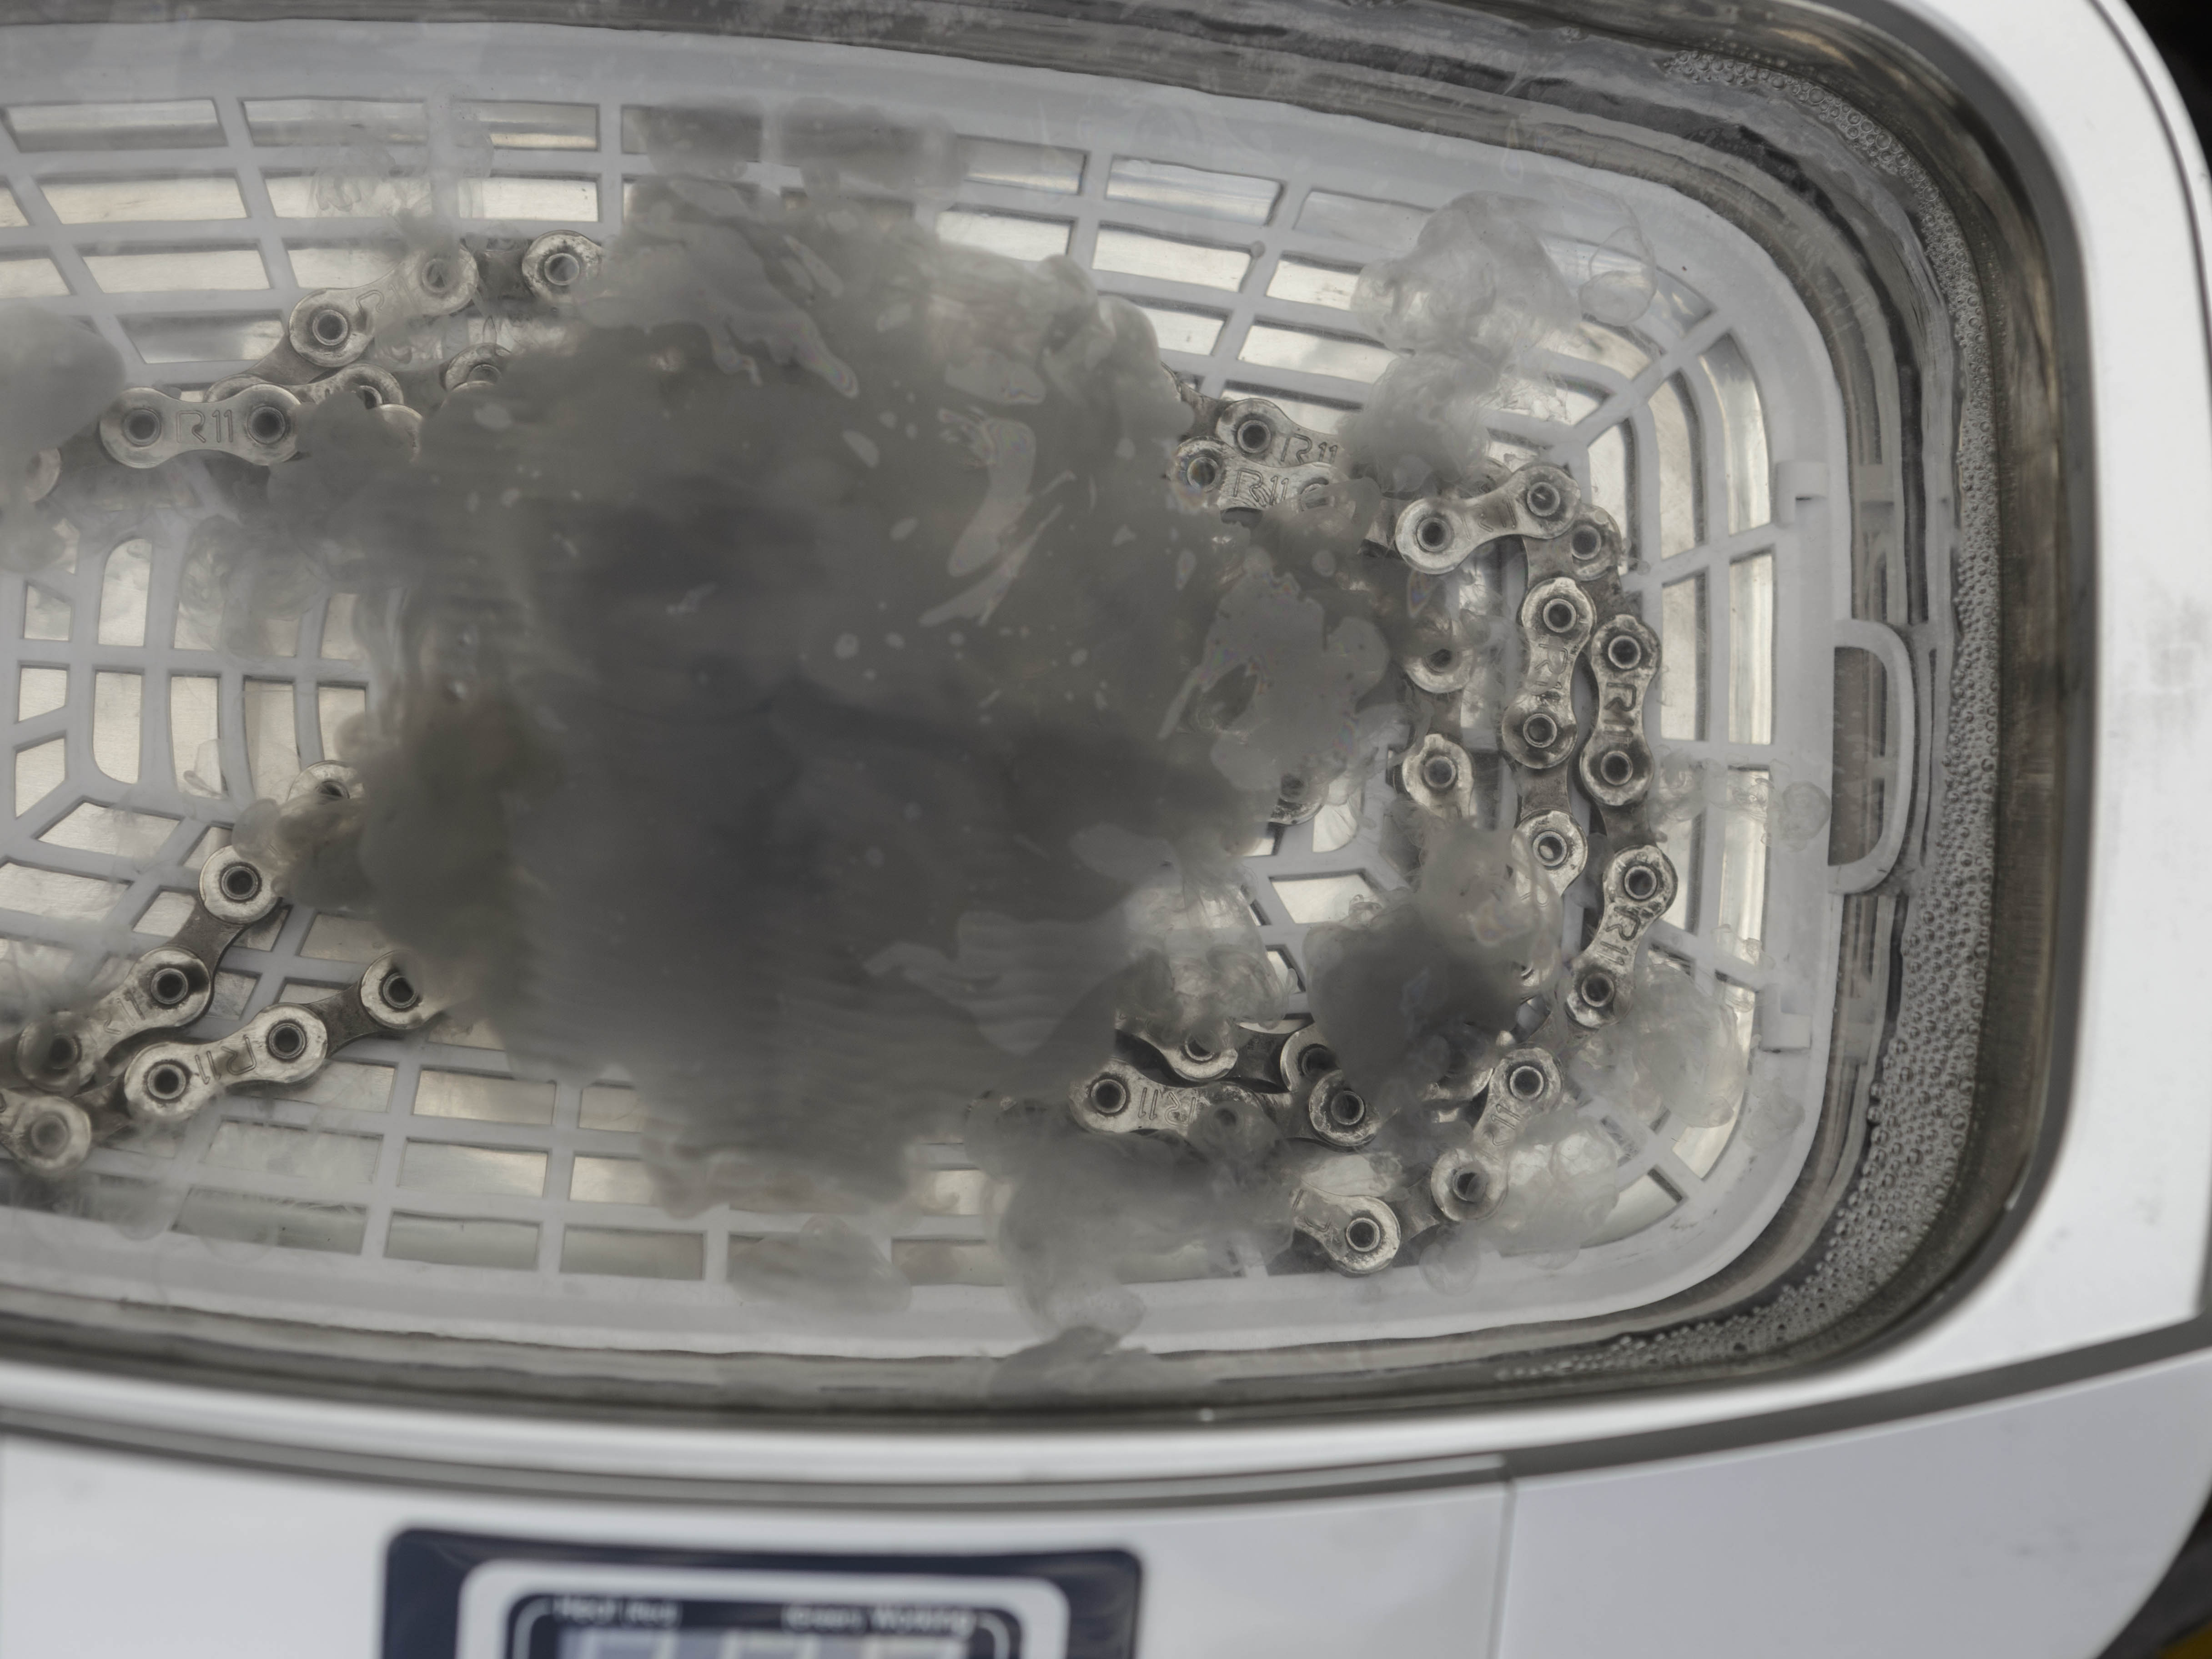
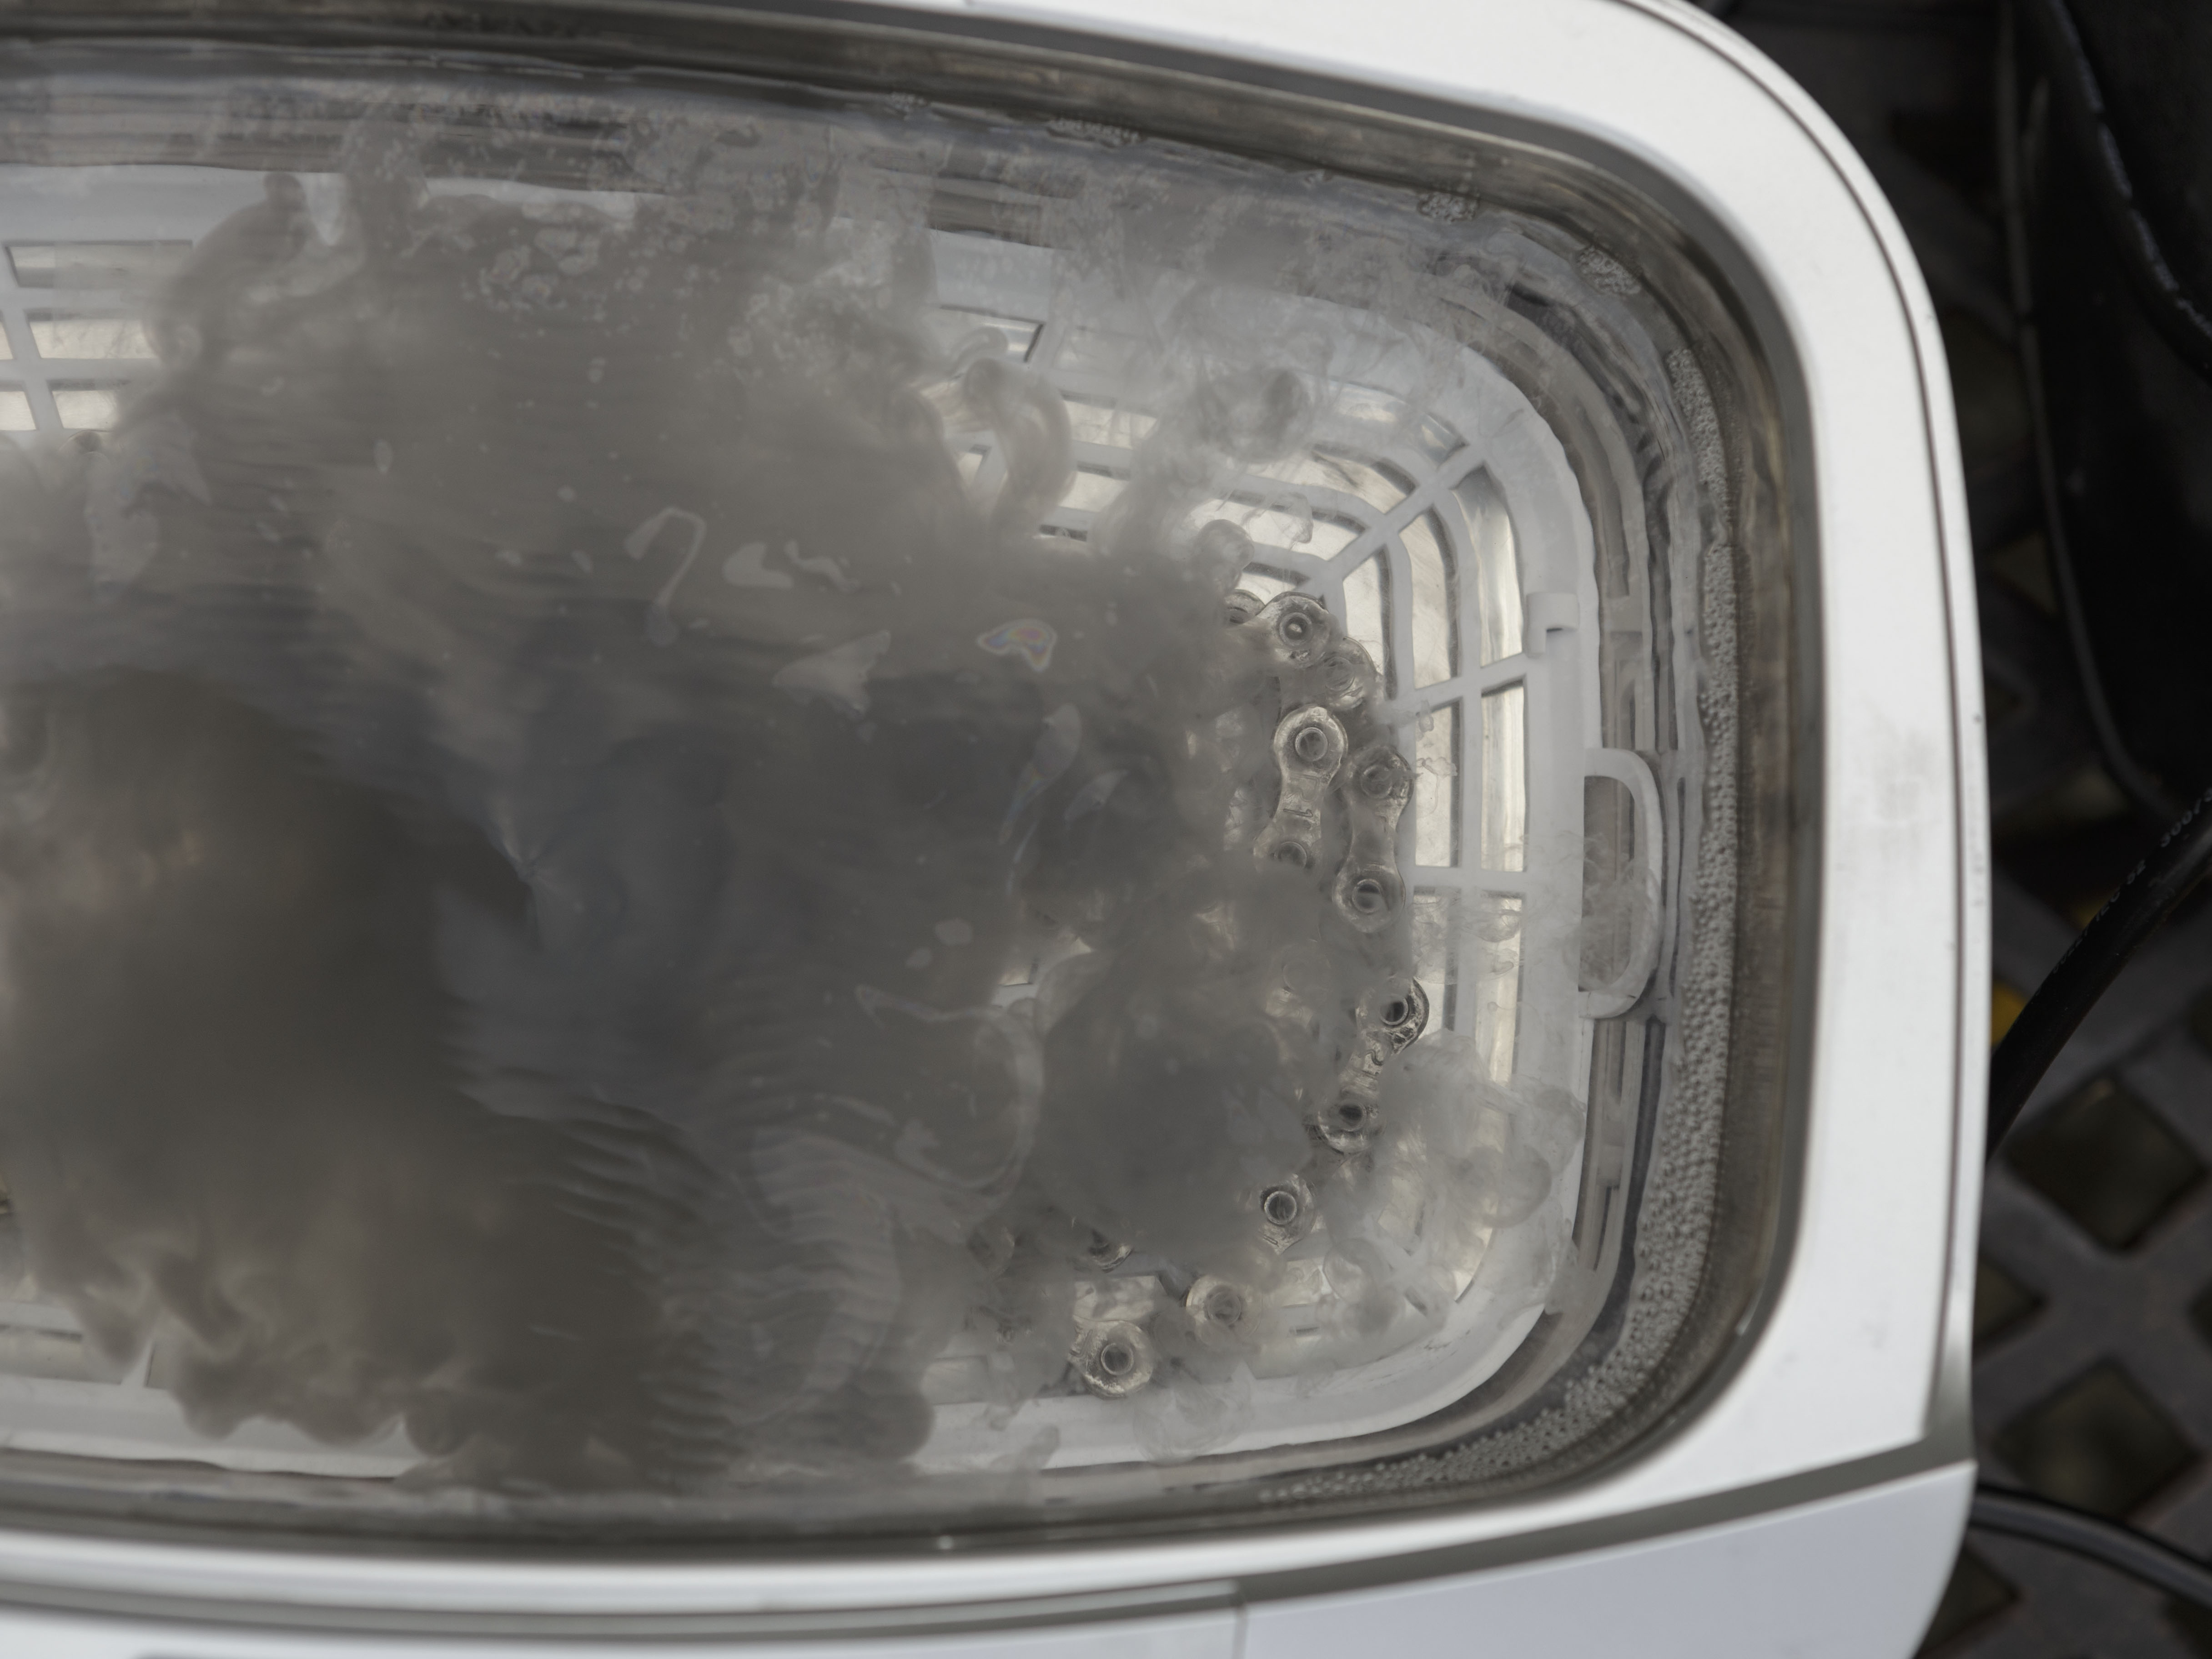
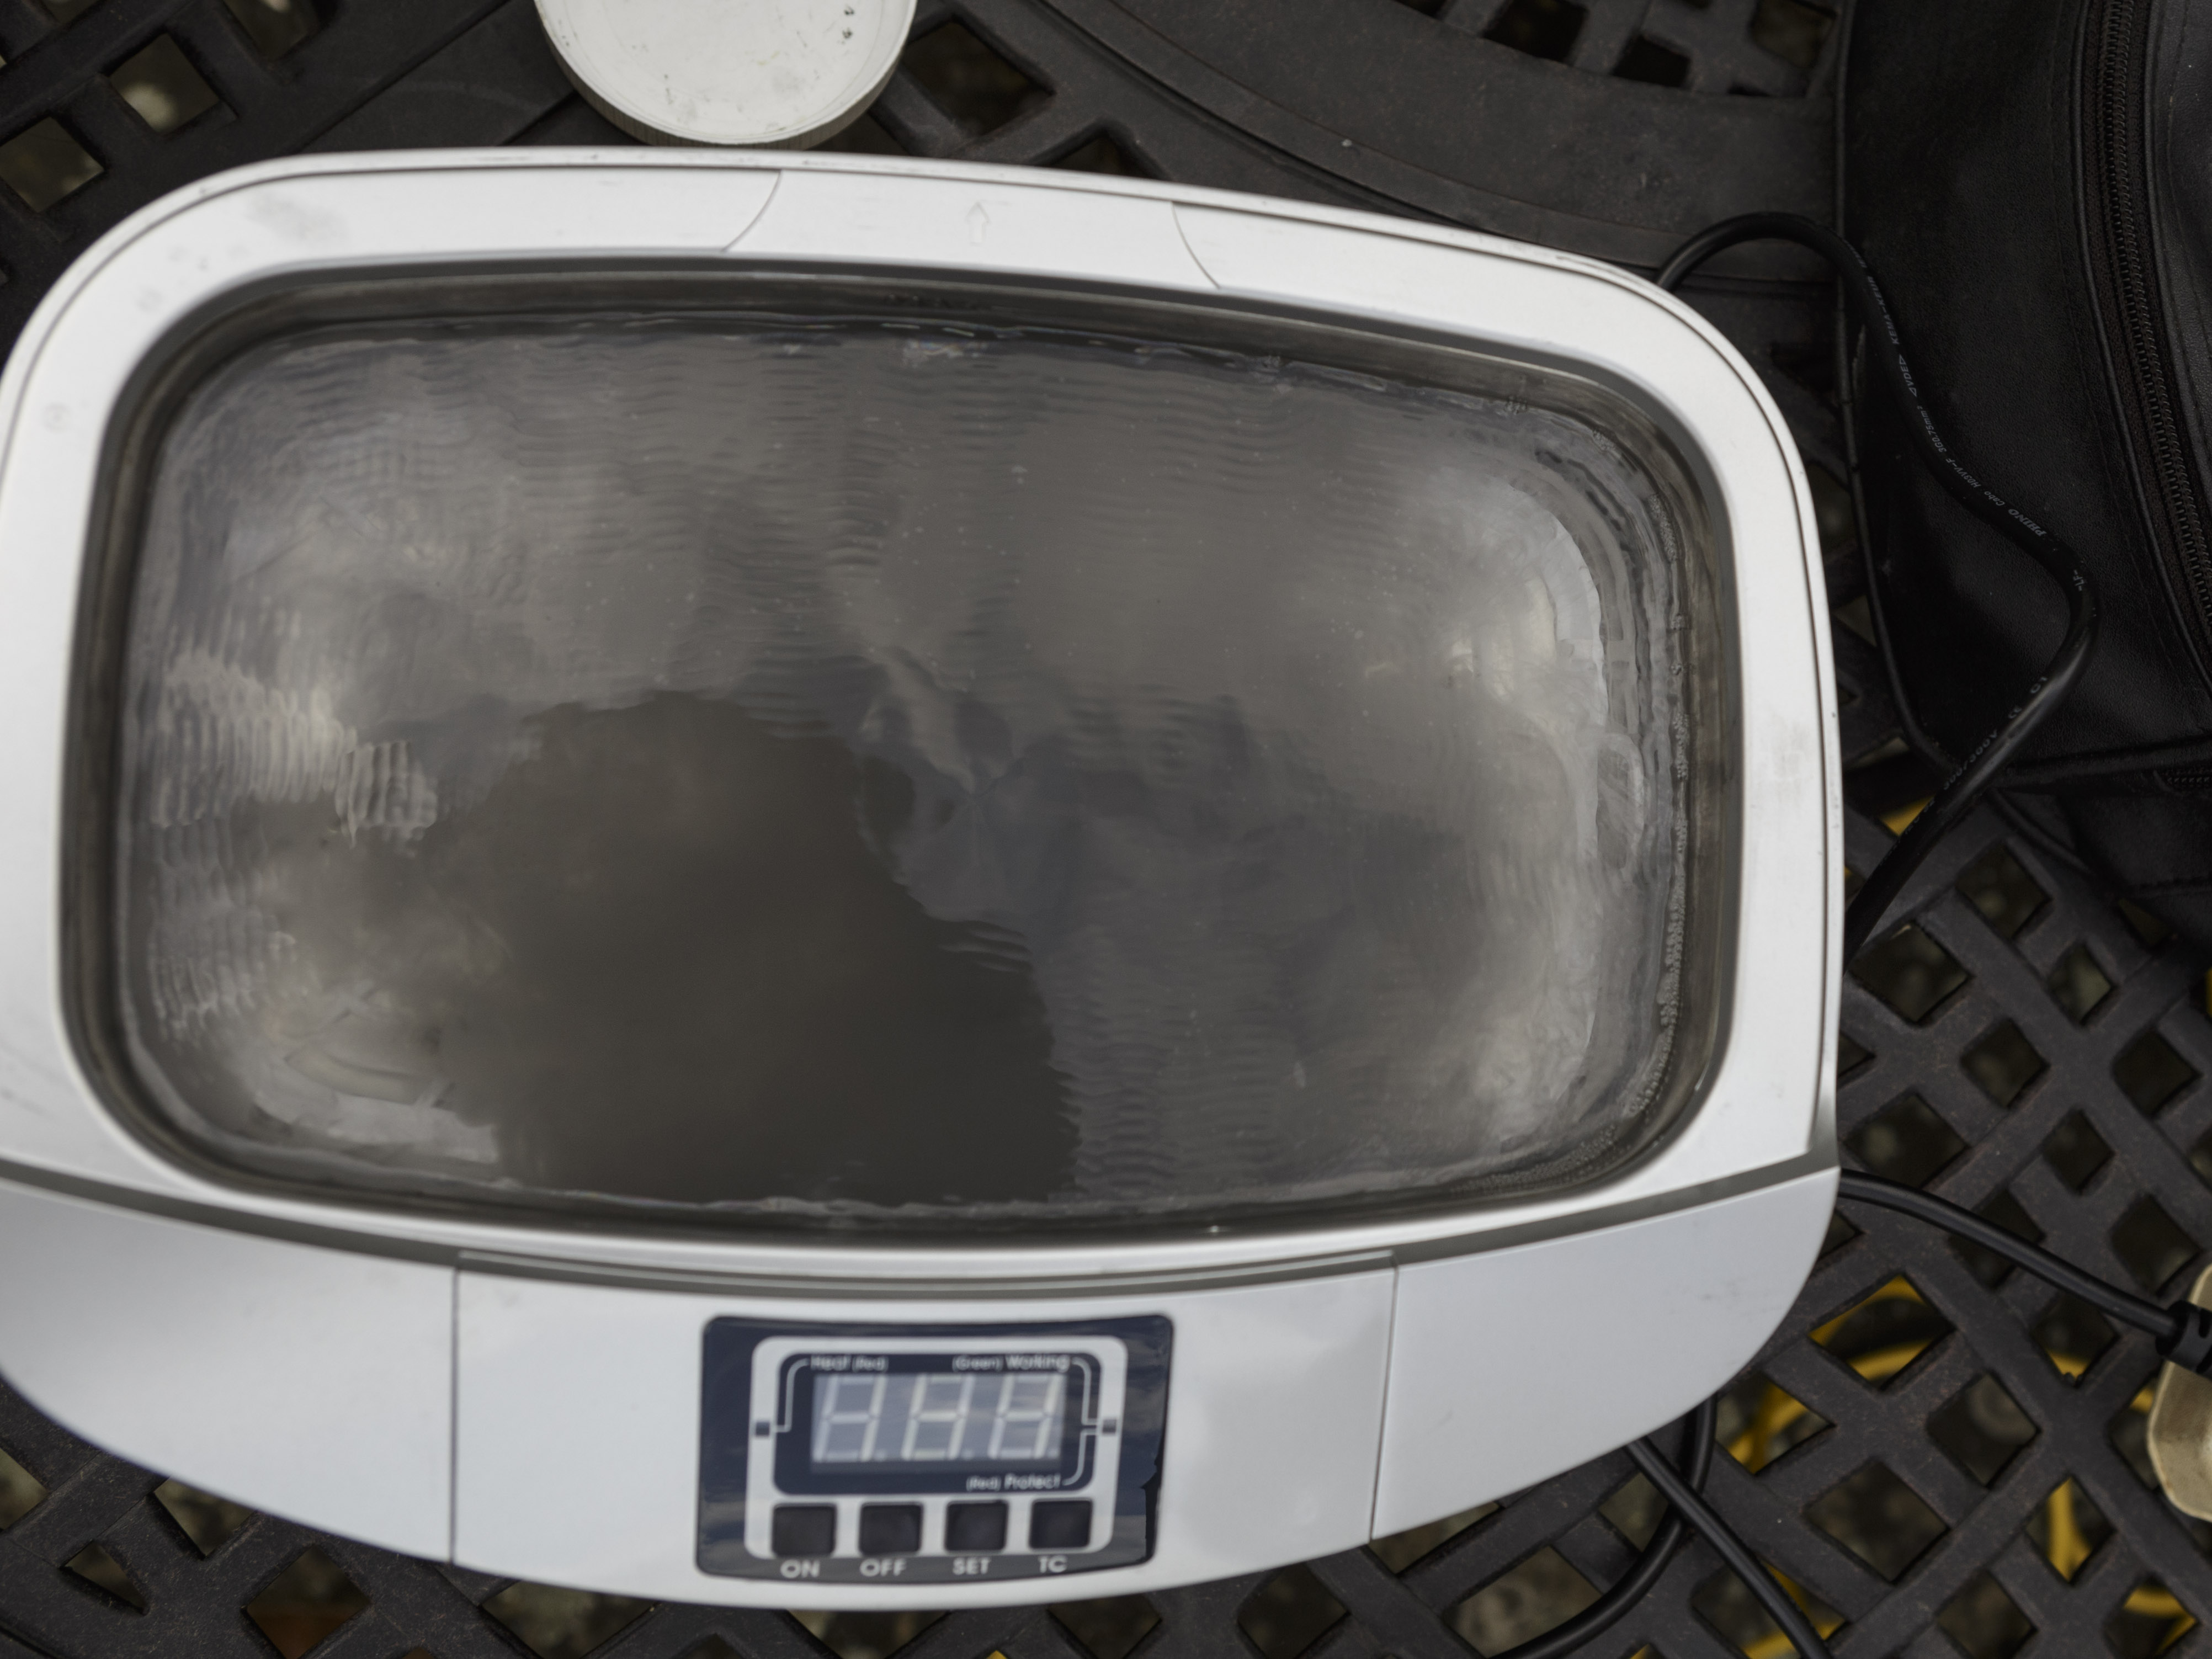
 -- Fish the chain out (I use a spare spoke) and wipe it dryish. -- Drop it into the 2nd bottle, and shake again. -- Fish the chain out and wipe it again. It should now look impressively cleaner than when you started. In fact most people think the job is done at this point - after all it looks clean. However If you handle it now, it will still feel �gritty� as it moves about. The chain is merely de-greased and the real internal cleaning can now begin. -- Fill the Ultrasonic Cleaner bath with hottish water and a couple of drops of washing-up liquid (the w/u liquid is there not for its detergent effect, but to reduce the water�s surface tension and thereby greatly enhance the cavitation effect, which is how ultrasound cleans things). -- Put the chain in and switch the machine on for 3 minutes. You will immediately see a �black mist� rapidly emerge from an otherwise apparently clean chain, and soon the whole bath is black. I am entranced by this. The black stuff, or the emergence of it from inside the chain, is the whole point of this exercise. It is a mix of aluminium oxide particles, (essentially ground-up sapphire, one of the hardest naturally-occurring minerals and therefore widely used as a grinding agent), iron oxide (ground rust, aka rouge, another polishing/fine-grinding agent) and ground glass, flint and sand (also highly abrasive). This is stuff you do not want mixed with lube inside your chain, yet almost nobody ever gets rid of it properly. The ultrasonic cleaner does so. The four overhead photos of the cleaner in action were taken respectively, 0, 2, 5 and 14 seconds after switching it on: 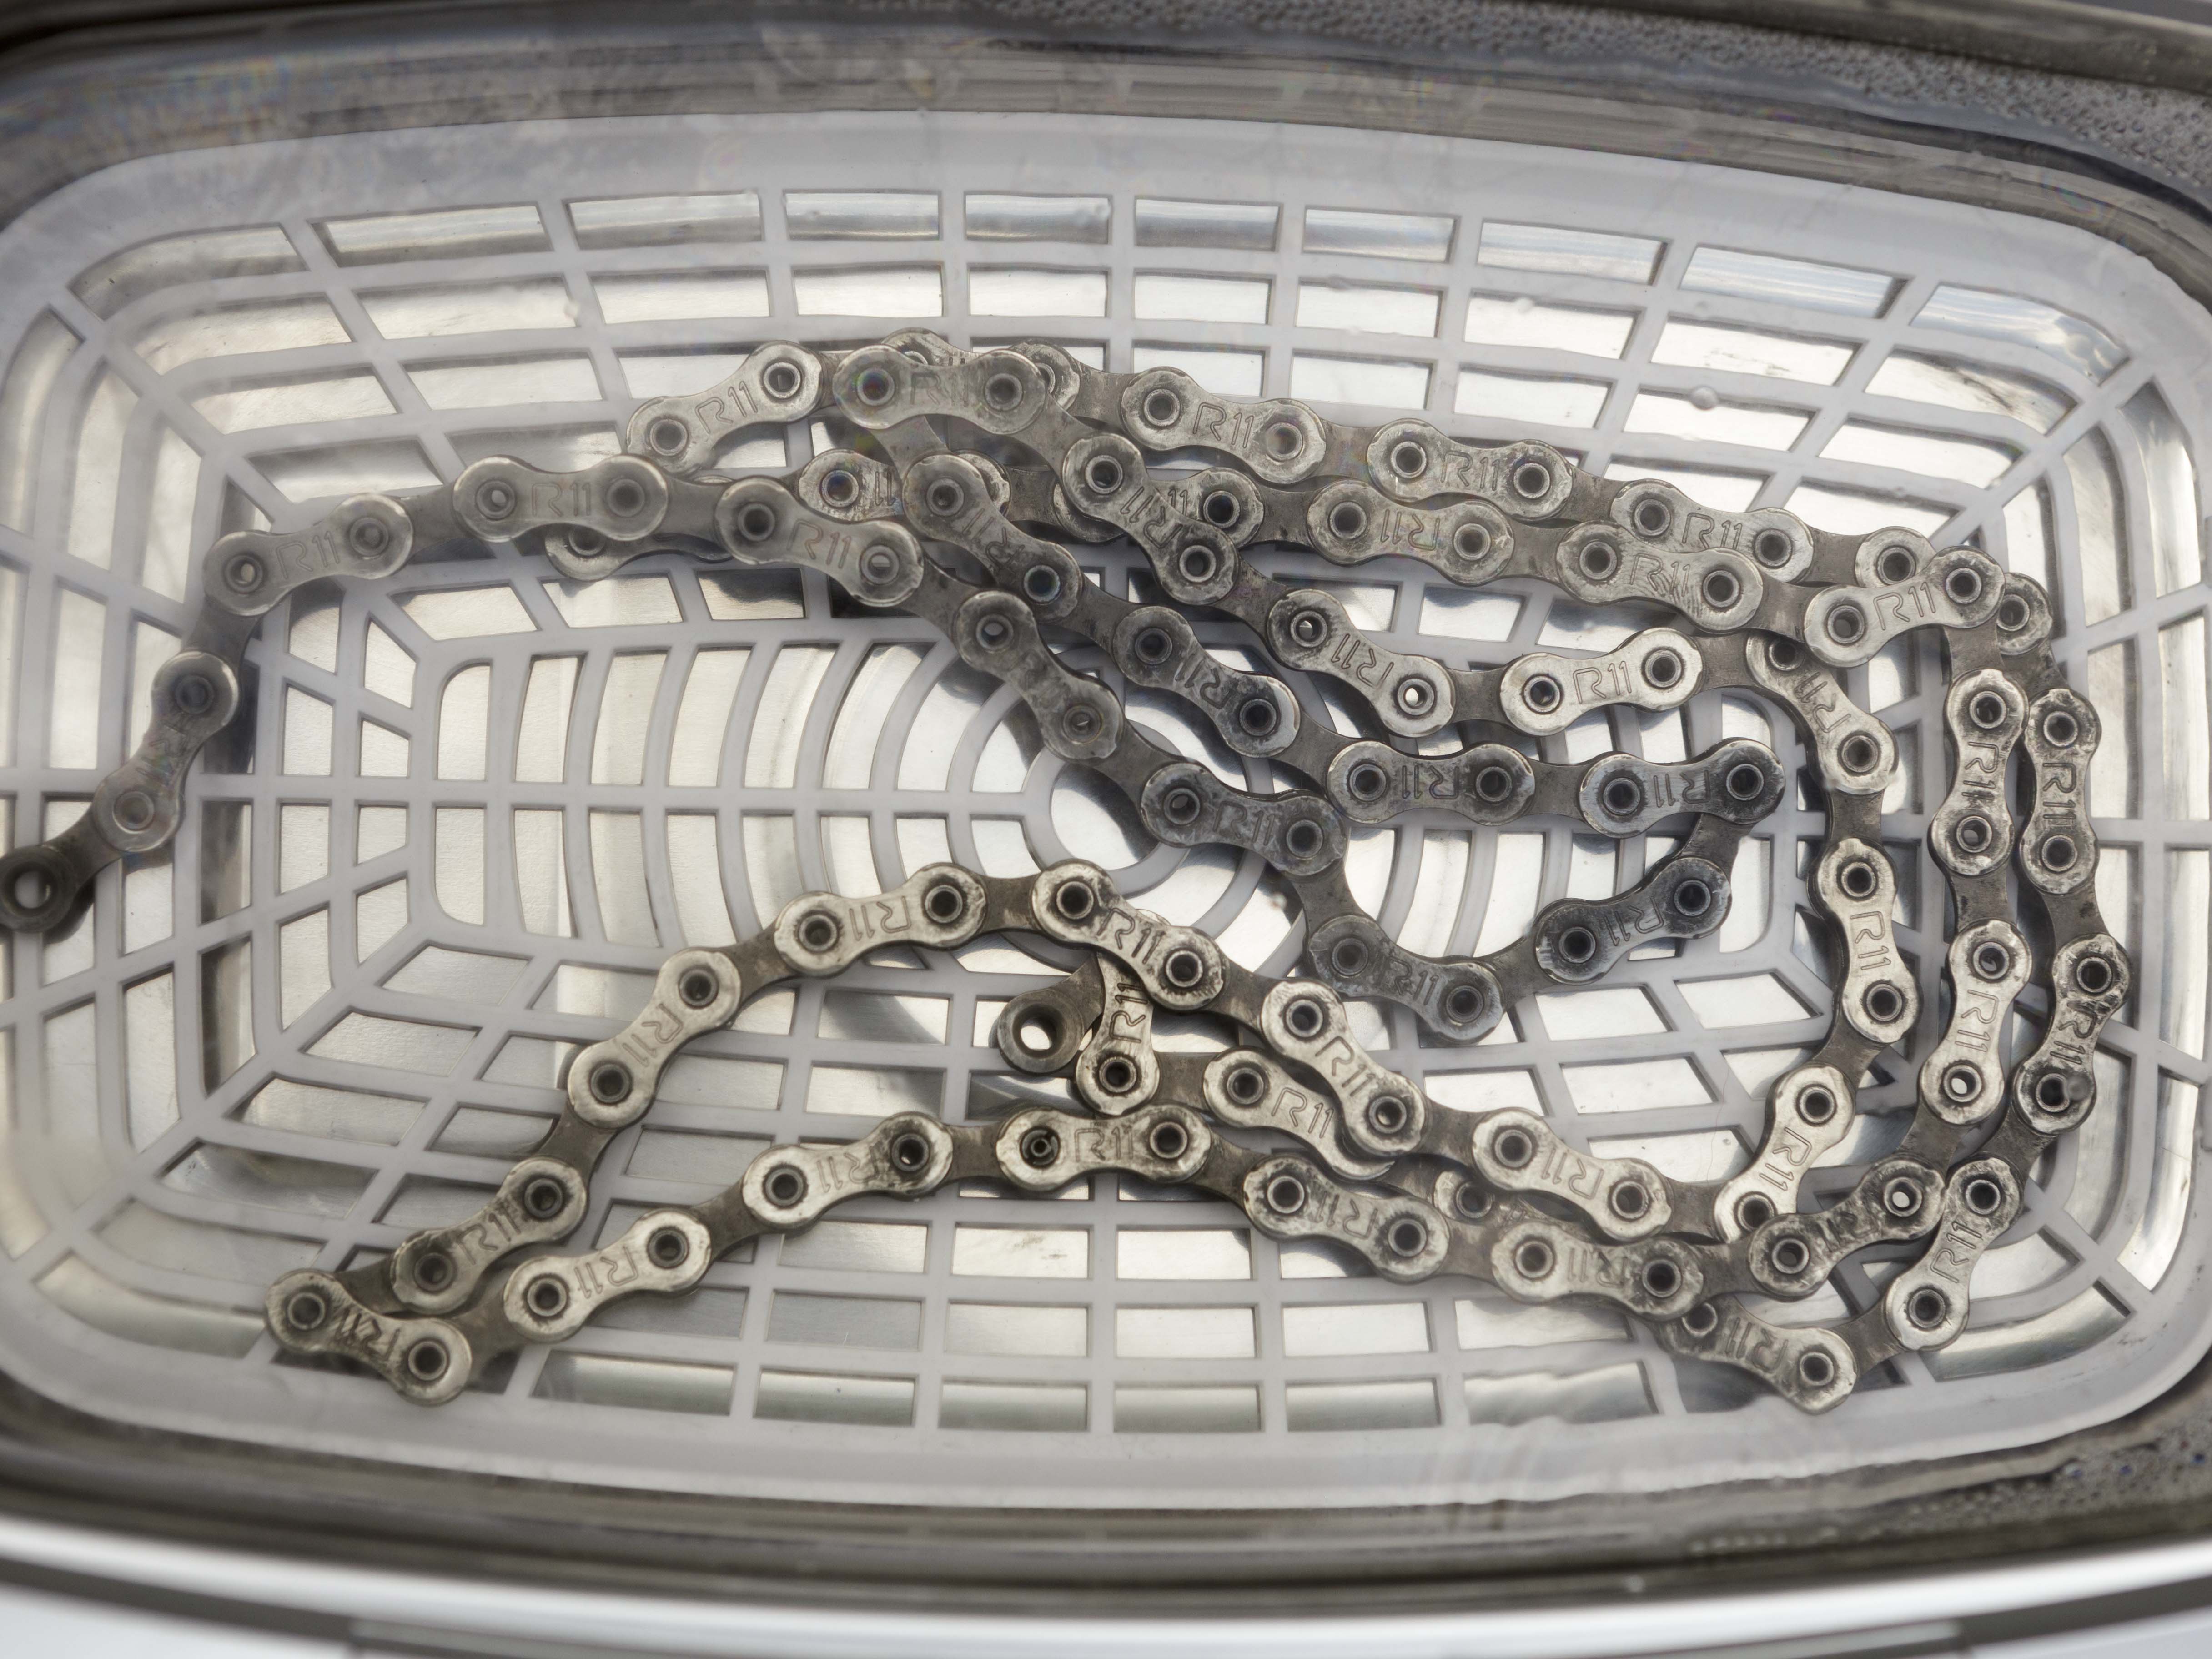
-- Pour off and replace the hot water/detergent and do another 3 minutes: you�ll see the �black mist� is much reduced. Move the chain around a bit too to ensure all links enter the areas of high wave-concentration. -- Remove the chain, rinse it in clean water and dry it thoroughly (110 degrees C [230 F] on a plate in the oven for a few minutes is how I do it). 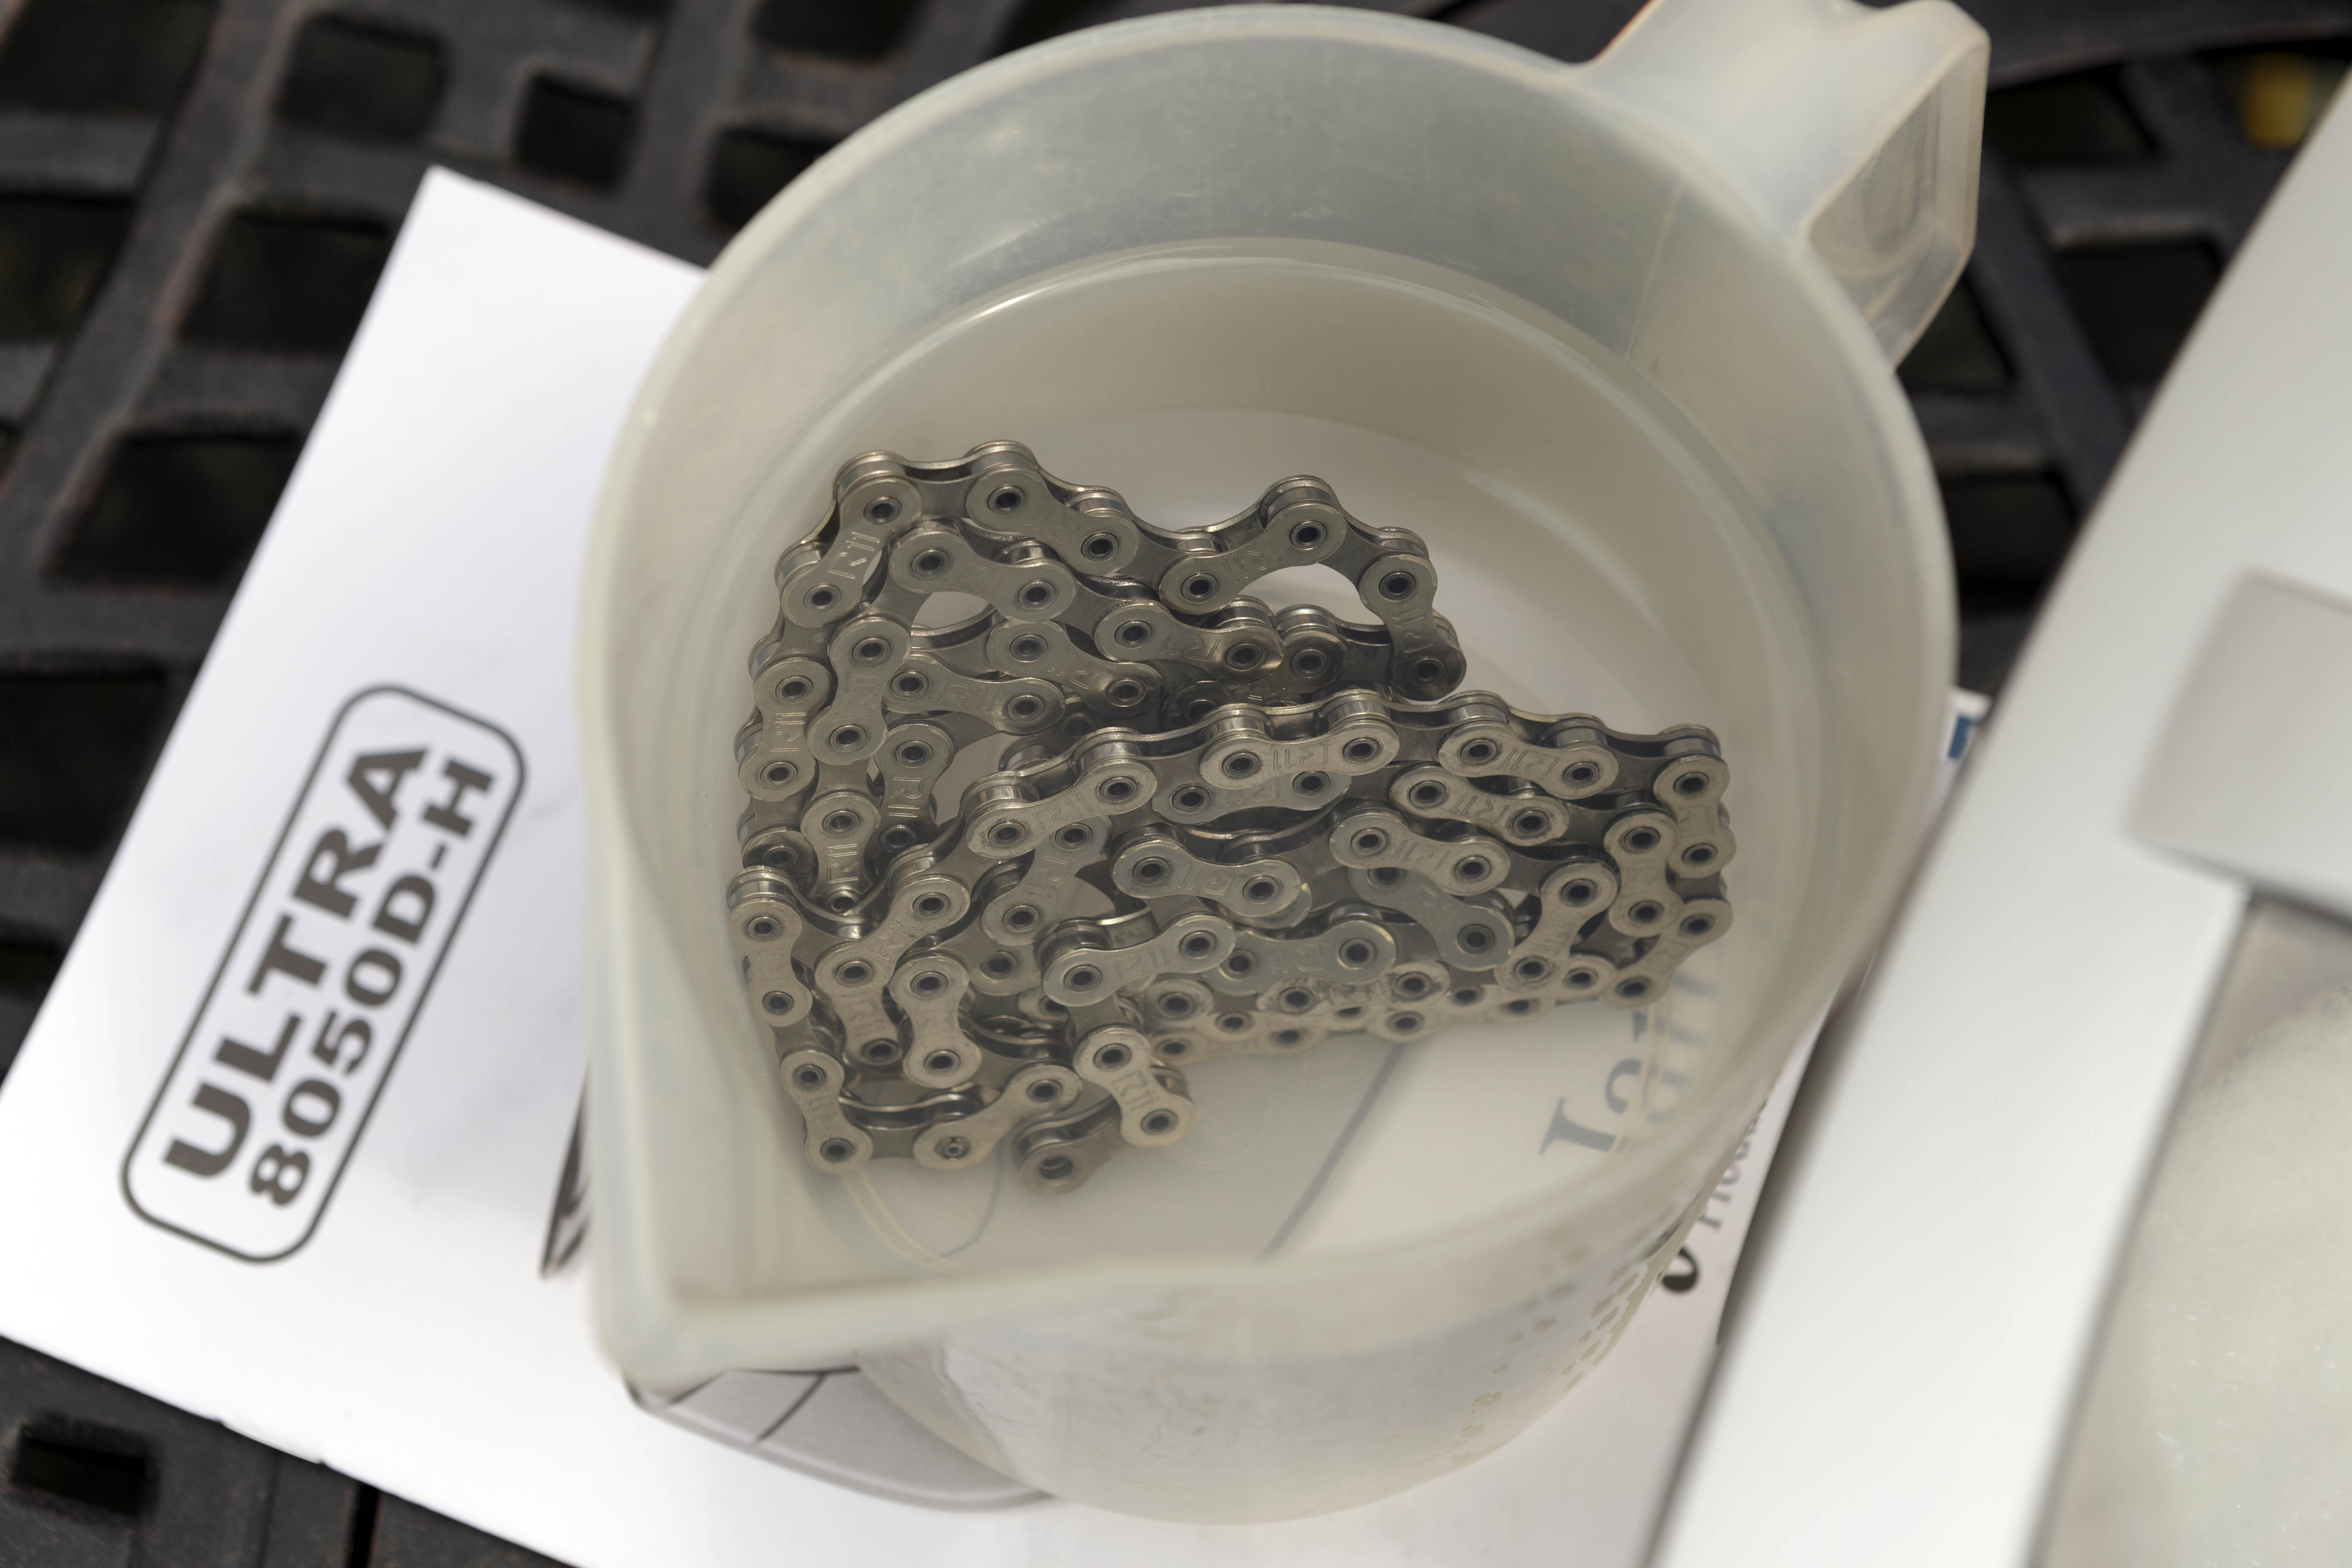
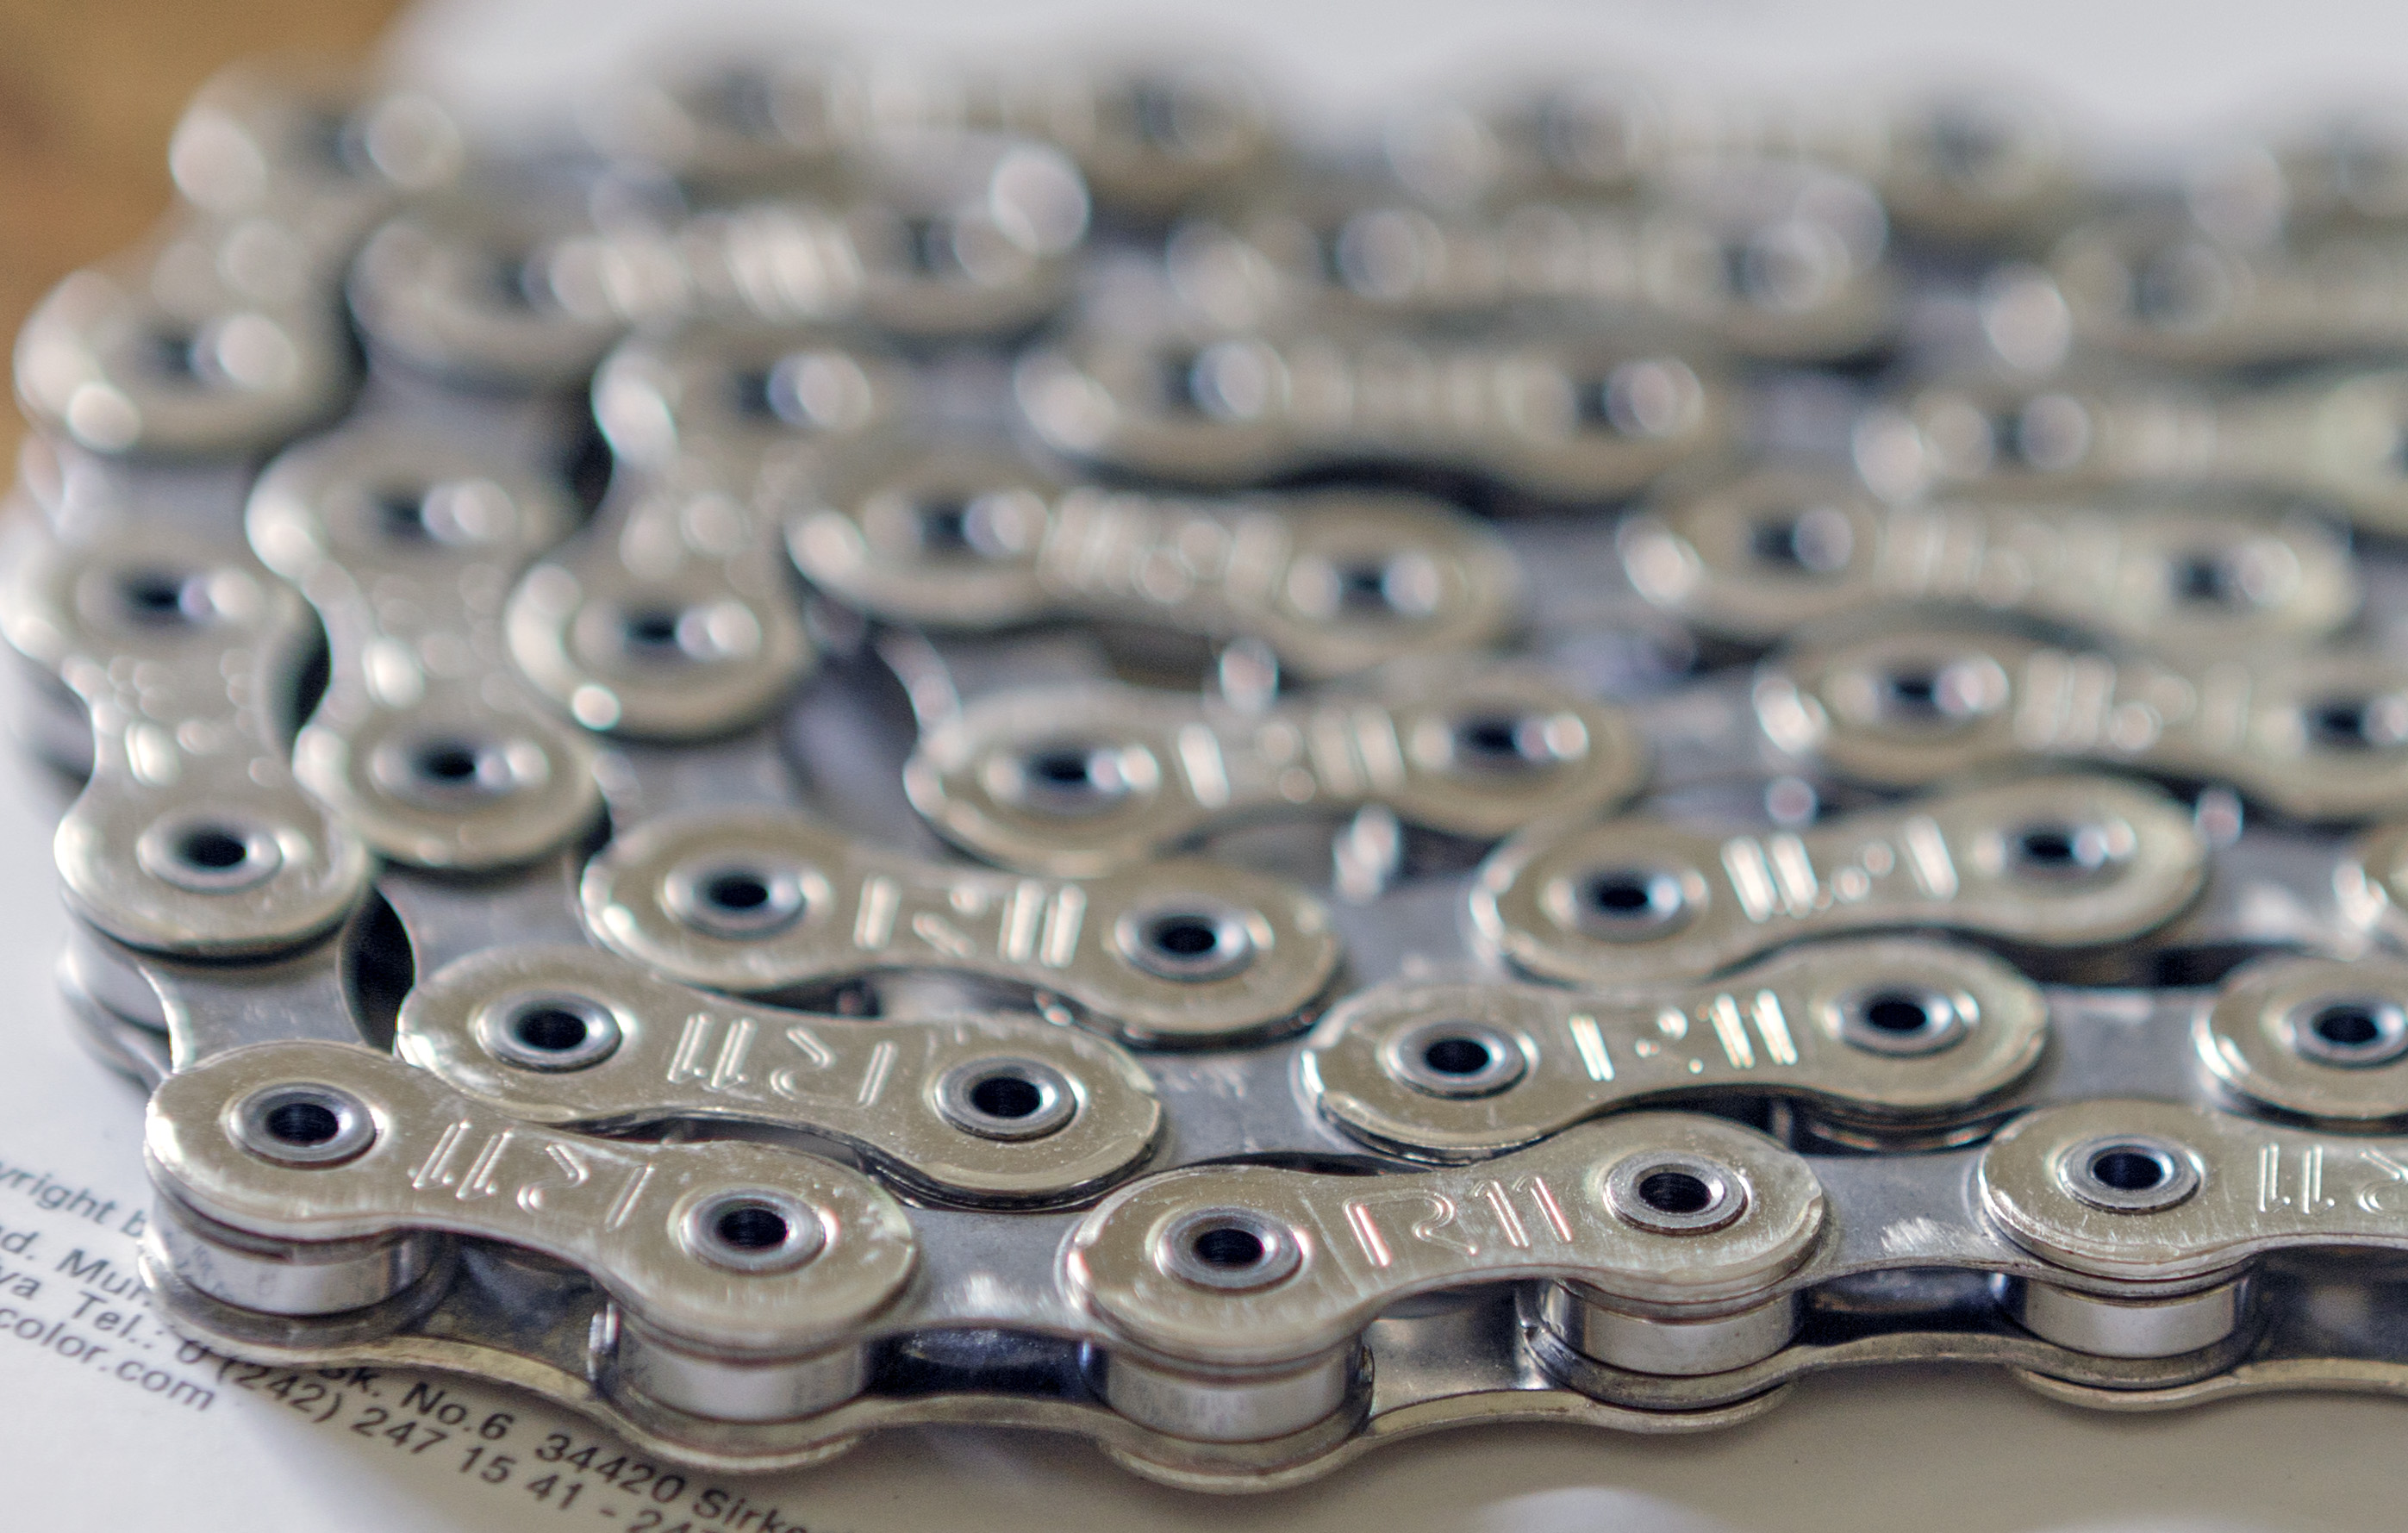
-- Now inspect it � it is indistinguishable from brand new! Also put your ear to it as you move it around, the gritty feel and sound is gone, meaning it's as clean inside as out. Fit it to the bike and lubricate to taste. 
In addition, I remove the cassette and also give it the ultrasound treatment after similarly shaking (just once) in a tub of white-spirit, a quick wipe and rinse then back on the bike, and also give the chain-rings and d�railleurs a wipe with white-spirit cloth while the chain�s off.  The main point of this article is to point out that many people clean their chains using a method very similar to this up to the point of the ultrasonic cleaner. But my point is that the only real cleaning is done by the ultrasonic cleaner. Until then almost all the "bad stuff" is still inside the chain's internals. That's why when the machine gets switched on, the apparently clean chain produces masses of black stuff, and it's only when this has been removed that the chain can be considered clean from a grinding-paste point of view. Re-Lubrication Having now achieved a factory-new clean chain and sprockets, the next big issue is re-lubrication. The first time you clean the chain like this, the chances are you've never had to deal with a perfectly clean chain before. I won't go deeply into this topic here, mainly because I'm still experimenting. Suffice to say that a very clean but poorly lubricated chain will be rattly and squeaky. I initially tried a thin penetrating lube called "Purple Extreme" which has impressive claims made about it. Unfortunately it lasted about 15 miles before it started squeaking! What I currently do is 2-stage, before I put the chain back on the bike. I lay the chain flat and first drop Purple Extreme into every link, because it's highly penetrating, then slink the chain about a bit, to allow it to get inside the links. Then I drip some engine oil using an old bike-lube dropper. It hasn't squeaked since. But it can get a bit rattly if the whole d�railleur set-up isn't perfectly aligned, so I am looking into some thicker alternatives at the moment. Conclusion So I await to see if this actually increases the useful life of my chain, previously I'd get around 3,000 miles of all-weather use, about 4 months in my world. In due course I'll report back and update. Perhaps also there's a lubrication article to come later. |
||||||||||||||||||||||||||||||||||||||||||||||||||||||||||||||||||||||||||||||||||||||||||||||||||||||||||||||||||||||||||||||||||||||||||||||||||||||||||||||||||||||||||||||||||||||||||||||||||||||||||||||||||||||||||||||||||||||||||||||||||||||||||||||||||||||||||||||||||||||||||||||||||||||||||||||||||||||||||||||||||||||||||||||||||||||||||||||||||||||||||||||||||||||||||||||||||||||||||||||||||||||||||||||||||||||||||||||||||||||||||||||||||||||||||||||||||||||||||||||||||||||||||||||||||||||||||||||||||||||||||||||||||
|
The Puncture Fairy
Browse cycling forums or read the literature and you�ll find references to a creature called �The Puncture Fairy�. It is never directly observed, but is a creature which, without warning and at the most inconvenient times, causes you to have a puncture. Use of the term Puncture Fairy implies that we, the riders, have no control over when and where the punctures occur, they�ll just �happen when they happen� and we must simply accept them. However, a little thought reveals that actually there is plenty we can do to keep the PF away and dramatically reduce our frequency of puncture. True, there are some types of puncture about which we can do very little, but they are rare. In order of likelihood, the main causes of puncture are: Standard Small-Shard Punctures By far the most common cause of a PF visit, and more often than not in the wet. Contrary to common belief, most punctures do not happen in one single pfffft! after collecting a piece of glass. They happen gradually, starting with a sharp piece of glass, stone or sand becoming embedded in the rubber of the tyre. Thereafter, each time the wheel rotates, the rubber around the shard deforms at the flat �contact patch� causing it to move around a bit in its little rubber cocoon, making its way a little further in. In the dry it makes little progress, because it�s pretty firmly held in place and prevented from moving by the sticky rubber on each side. When it gets wet, though, it�s a different story in two ways. The shard is no longer held in place by sticky rubber, it�s lubricated, and gets moved around much more on each rotation, cutting its way in. Furthermore, rubber is much easier to cut when wet, so this double whammy means that the shard makes its way through the tyre and into the tube almost always in the wet. Which also means that if your tyre picks up a shard on a ride, it may be several days or weeks before it actually becomes a puncture. It�s highly likely that your next few punctures are already embedded in your tyre! How To Prevent: Do a pre-flight check. I commute 19 miles each way every day to and from work, but I rarely get punctures even though I use 23mm racing tyres at 110-120 PSI. In my under-saddle bag of essentials, I keep an inner tube, a pair of tyre levers and, crucially, a small Swiss Army penknife. Before every ride home, I spend 5 minutes slowly rotating each tyre under my nose hunting for embedded bits of glass/stone and digging them out with the tip of the knife. Especially after wet rides, I�ll often find one or two that would otherwise definitely have become punctures. Do it to your bike now � you�ll be amazed the first time you do it how many you have waiting for you. 5 minutes per day. Pinch Flats These should never happen to an experienced road rider. The only excuse for one of these is if your tyres are already soft from a puncture from another cause. A Pinch Flat results from an underinflated tyre, which briefly squeezes flat when ridden over a hard edge such as a kerb or pothole, crushing the inner tube in a sandwich of rim/tyre/inner and punching one or more small holes into it. Pinch flats can produce up to 4 holes in one go in the inner tube, and are easily avoided by having correctly inflated tyres to start with. Carpet-Tack, Nail or Screw These cause instantaneous puncture and are almost impossible to prevent, but they should be rare. Rim Manufacturing Faults (esp for Clinchers) Poor rim manufacture can cause misaligned brazing of the two meeting faces of the wheel rim, causing a tiny but sharp metal ridge on what should be a perfectly smooth inner rim edge. I wouldn�t have included this, but this has happened to me, causing 3 confusing punctures in a single ride. It took me ages to diagnose it once back home. The sharp ridge, over many miles, gradually rubbed its way through the sidewall of the tyre just by the bead, and once worn through was in direct contact with the inner tube, which offers no resistance at all. Similarly, but more due to poor maintenance than poor manufacture, punctures can happen at the spoke-holes if the rim-tape is old or worn. However these are both uncommon. How To Prevent: Regularly inspect the rim and/or the inside of your wheels. |
||||||||||||||||||||||||||||||||||||||||||||||||||||||||||||||||||||||||||||||||||||||||||||||||||||||||||||||||||||||||||||||||||||||||||||||||||||||||||||||||||||||||||||||||||||||||||||||||||||||||||||||||||||||||||||||||||||||||||||||||||||||||||||||||||||||||||||||||||||||||||||||||||||||||||||||||||||||||||||||||||||||||||||||||||||||||||||||||||||||||||||||||||||||||||||||||||||||||||||||||||||||||||||||||||||||||||||||||||||||||||||||||||||||||||||||||||||||||||||||||||||||||||||||||||||||||||||||||||||||||||||||||||
|
Richmond Park, London
 click the image for a full-size and zoomable version to appear in a separate window.
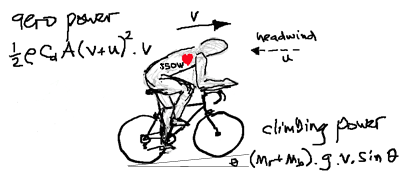
I am very familiar with Richmond Park in London, England. On my daily cycle commute alone I must have climbed Dark Hill and Broomfield Hill hundreds of times. The Park includes a very useful 10.7km (6.7mi) road circuit used by many cyclists and clubs from around London, and contains some notable short hills. They are: -- Dark Hill, average 5.8%, 480m. From Kingston Gate roundabout, starts at about 5% but soon ascends two little ramps of 10-11% separated by 80-odd m of 2-3% "rest". -- Broomfield Hill, average 4.3%, 965m. From Robin Hood roundabout to the car park at the top, starting flat and gradually increasing to over 13% before it rounds off towards the top. -- Sawyer's Hill, average 2.6%, 1.4km. From Sheen crossroads to the crest a few hundred metres short of Richmond Gate, touching 9% at one point. The road circuit is so intensively used by racing cyclists, and so familiar to me, that I thought it would be fun and useful to model it with the mathematical tool mentioned above, and be able to simulate a circuit around the Park under various conditions and cyclist power. GRADIENT MAPPING the PARK To model a course, one needs to know at any given point what the gradient is, and to do that I spent a day in late summer 2012 walking around the Park with a hand-held GPS unit (for position), long spirit-level and bevel-box (for the gradients), and a notebook. Every 50-60 metres I stepped into the middle of the road to physically measure the angle of the road-surface versus horizontal. On the hills the intervals were much closer. It took nearly five hours, and I recorded 200 gradient data points. My right leg took days to recover from 200 fencing-style "lunges"! To those cyclists hurtling down Broomfield whose hearts leapt into their mouths after committing to the scary adverse-camber corner at 35+mph only to see me step into the road, I sincerely apologise! I deserved your curses for trying to judge too finely how much time I had to get back out. The picture at the top of this article is a product of all this. The dark line is the altitude profile of the Park starting from Kingston Gate roundabout and going anticlockwise, i.e. starting up Dark Hill. The green line is speed. The cyclist I have modelled for this image is producing a constant 350W, weighs 82kg on a 7kg bike with tyres with a rolling resistance of 0.004, has a total frontal area of 0.47 m2 and a drag coefficient of 0.8, (imagine perhaps a fit commuter with a rucksack down on the drops fitting in a circuit of the Park for training - any resemblance to me purely coincidental :) !). The wind is 5mph from the west, it's 20 degrees Celsius and air pressure is 101.8 kPa. All those values are inputs to the model, plus a few other more subjective tweaks such as adjusting for having to slow at sharp corners and freewheeling (i.e. temporarily zero power) beyond a certain downhill gradient. The simulation suggests the cyclist under these circumstances would complete the Park circuit in 17:42. HOWEVER, had the air pressure that day been 95 kPa instead of 101.8 (perfectly possible), all other factors unchanged, he would instead have done 17:21, over 20 seconds faster. OR, had he adopted a time-trail position and lost the rucksack, he would have done 15:02! |
||||||||||||||||||||||||||||||||||||||||||||||||||||||||||||||||||||||||||||||||||||||||||||||||||||||||||||||||||||||||||||||||||||||||||||||||||||||||||||||||||||||||||||||||||||||||||||||||||||||||||||||||||||||||||||||||||||||||||||||||||||||||||||||||||||||||||||||||||||||||||||||||||||||||||||||||||||||||||||||||||||||||||||||||||||||||||||||||||||||||||||||||||||||||||||||||||||||||||||||||||||||||||||||||||||||||||||||||||||||||||||||||||||||||||||||||||||||||||||||||||||||||||||||||||||||||||||||||||||||||||||||||||
|
SIMULATING RIDES & PREDICTING RIDE-TIMES
Below I present some more organised results using the simulation for Richmond Park, showing, for various different rider weights, tables of time-round-Richmond-Park or "required power" for different combinations of power and position-on-the-bike. "How on earth?" do I hear you say? For details of how these results have been computed, see the articles nearby: The Physics of Bike Riding and Details of the Simulation. For these tables I have assumed: no wind (except the Wind Analysis, if I've included it yet); a bike weighing 8kg; an anti-clockwise route round the Park. Richmond Park TT: Time for combinations of Power vs Rider Position Observation: your riding position is extremely important.
Richmond Park TT: Required Power for combinations of Time vs Position This is a similar analysis to that above except from a different viewpoint. Rider Weight 75kg
Richmond Park TT: Time for combinations of Power & Rider Weight Observation: a 70kg 300W rider will save less than a second around the Park by shaving 200g (7 ounces) from the weight of the bike.
|
||||||||||||||||||||||||||||||||||||||||||||||||||||||||||||||||||||||||||||||||||||||||||||||||||||||||||||||||||||||||||||||||||||||||||||||||||||||||||||||||||||||||||||||||||||||||||||||||||||||||||||||||||||||||||||||||||||||||||||||||||||||||||||||||||||||||||||||||||||||||||||||||||||||||||||||||||||||||||||||||||||||||||||||||||||||||||||||||||||||||||||||||||||||||||||||||||||||||||||||||||||||||||||||||||||||||||||||||||||||||||||||||||||||||||||||||||||||||||||||||||||||||||||||||||||||||||||||||||||||||||||||||||
|
How the Simulation Works
Take a look at the tables of predicted time and power elsewhere on this page. One table suggests that on a windless day in Richmond Park, a 75kg rider on an 8kg bike in the drop-handlebars position producing a constant 250W will get around in 18 minutes 29 seconds. A common reaction to such a specific and confident prediction is "how can you possibly work that out?", and/or simple disbelief. Here I'll try to describe how. The physics of what's going on when riding a bike are well known, (see elsewhere on this site) and take the form of a few equations. These equations require us to know or estimate the values of some rider & bike-specific inputs such as coefficient of drag (Cd) and presented frontal area, coefficient of rolling resistance (CRR) etc. Lots of work has been done on all this and values for these are all fairly well known and documented. Presented frontal area can easily be measured using digital photos, and scaled up or down for different rider weights. The equations also require some �environmental� inputs, such as course directions and gradients and air temperature and pressure. So, if we know all the variables: the rider (power, position and shape), the equations, the details of the course, the bike, and the environment, it stands to reason there is only a single time consistent with all that. How to determine that time, though? Here's how: We divide time into small chunks, say 0.01 seconds, and treat the rider's total Kinetic Energy ("KE") rather like a bank account, with regular statements at 0.01s intervals. KE=½mv2 + ½Iw2 (where I and w are wheels' MomentofInertia and AngularVelocity). So if you know the KE, you know the speed, and vice versa. For the purpose of this simple illustration, assume a stationary start (i.e. zero velocity at t=0) up a slight incline. First Time Slot In the first 0.01s, our 250W rider will supply 2.5 Joules of energy. For this initial time slot he has zero velocity, so he loses nothing to aero drag, nothing to rolling resistance, nothing to bearing losses and nothing to climbing, all of which require velocity to have a value. Thus at the end of this time slot all the energy supplied is still available, and we can add it to the rider's total KE. Since the rider now has a known KE, he has a known velocity for the next time slot. Second Time Slot At the start of the 2nd time slot, he has a certain speed and a certain KE. During the 2nd 0.01s he adds another 2.5 Joules, but he's now moving so he loses some energy to rolling resistance, some to aero drag, some to bearing losses and some to climbing. This energy lost is subtracted from the energy he has supplied, and the remainder gets added to his total KE balance, and his new increased velocity computed. Because he was moving at the start of this time slot, he has also covered a certain distance during the 0.01s. This is recorded and added to the cumulative distance travelled. Every Subsequent Time Slot ... You can see the pattern. For each slot, the rider has a certain starting velocity determined by his KE at the end of the prior one. During this slot, he supplies some energy, loses some to the various processes, the KE and velocity are recomputed, and cumulative distance recorded. When the cumulative distance equals the total course length, the whole process stops and we know how long it�s taken because we�ve traversed so many time slots. It�s worth noting a couple things, though. Firstly during any time slot, some of the sources of energy loss can be �negative losses� (i.e. energy gains). For example, if the incline is downhill, the energy �loss� will actually add to the KE, increasing speed. Similarly for a sufficiently strong tailwind. Secondly, the energy supplied by the rider in a time slot (here 2.5J in 0.01s) will often actually be less than the losses incurred by aero, climbing etc. In which case the rider�s KE (and velocity) gets reduced by the deficit, and it is this mechanism that forces the rider to slow down up hills or into the wind. This process of advancing by a very small time step at a time, doing the energy accounting for constantly changing gradient, speed, wind etc recomputing the KE => the speed => the distance covered through each step allows us to keep track of how fast and far the rider has gone, and is very easy for a computer to do. Our 18:29 example above will have taken 110,900 steps, essentially dividing Richmond Park into 110,900 small intervals. Tweaks and Assumptions The energy accounting, gradient map of the course and factoring in of wind direction etc are all very well, but there are other things that ought to be taken into account which can have a significant effect on ride times. They include: - the propensity of a rider to "sit up" while climbing, temporarily changing both drag coefficient and frontal area; - the fact that when descending a series of hairpins, you cannot continue at 35mph just because the gradient/energy balance suggests you can. The simulation has a mechanism to limit speeds through corners for various corner angles (this feature is important: it makes as much as 10-15s difference over ~19 minutes on Richmond Park's few corners alone!); - the likelihood of a rider to freewheel (i.e. power supplied = temporarily zero) downhill above a certain speed, gradient and likely cadence. - for short hills, many riders temporarily increase power by a certain percentage while climbing. This has been built in as an "optional feature" to my simulation, so I would probably include it for a course with short ramps, like Richmond Park, but not for a prolonged climb where the power increase would be unsustainable. - Although I have taken account of wind speed and wind direction in the calculation of aero drag, I have not taken account of the fact that drag coefficient and frontal area probably change as the apparent headwind direction changes (actually various studies have found that they don't change much); - Also "course furniture" like woodland or buildings tend to shelter (or even funnel) wind by different amounts at different places and at different seasons. This I cannot factor in satisfactorily, so I ignore it. Either one can say that it will affect the average wind over the course, or one can use the simulation result for given wind conditions as a "worst case" and treat any likely shelter as a potential improvement. |
||||||||||||||||||||||||||||||||||||||||||||||||||||||||||||||||||||||||||||||||||||||||||||||||||||||||||||||||||||||||||||||||||||||||||||||||||||||||||||||||||||||||||||||||||||||||||||||||||||||||||||||||||||||||||||||||||||||||||||||||||||||||||||||||||||||||||||||||||||||||||||||||||||||||||||||||||||||||||||||||||||||||||||||||||||||||||||||||||||||||||||||||||||||||||||||||||||||||||||||||||||||||||||||||||||||||||||||||||||||||||||||||||||||||||||||||||||||||||||||||||||||||||||||||||||||||||||||||||||||||||||||||||
|
The Physics of Riding a Bike
A cyclist riding along at a known speed has a certain amount of kinetic energy, very easily calculated as 0.5 x totalmass x velocitysquared. As long as that rider maintains the same speed, the cyclist will maintain the same kinetic energy. Unfortunately there are several, in fact 5 major things, happening to and around the cyclist which cause the cyclist's kinetic energy to constantly drain away. Thus in order to maintain a speed, the cyclist needs to provide additional energy to replace that being drained, and if the amount supplied by the cyclist exactly matches that being drained, the speed will remain constant. Luckily, These 5 sources of energy loss can be quite accurately and simply replicated mathematically. They are aerodynamic drag, climbing, tyre rolling resistance, bearing friction (hubs, bottom bracket and pedals) and transmission losses (think rusty chain). 1. Aerodynamic Drag Imagine dipping your hand into a bathful of water and dragging it palm-first through the water. You feel a lot of resistance. This is exactly what happens when a cyclist rides in air, and although the air is less dense the rules are the same. It's called "fluid drag", and the energy lost goes towards displacing the fluid and creating turbulence, vortices and waves in the fluid. Now back to the hand-in-bath. Imagine turning it edge-on and dragging it the same distance as before. Much less resistance, obviously. There are two things going on here, one, that the projected area of your hand in the direction of movement is much lower than before (so that the water when displaced sideways has less far to go and come back round the back), and secondly the new shape of your hand as it passes through the water edge-on is inherently more "streamlined" than before. These two things are known as "Frontal Area" and "Drag Coefficient" (Cd) respectively. In the formula to calculate fluid-drag-power-loss they are multiplied together, along with air density and a velocity cubed term, in the following formula*: aero power loss = 0.5 x AirDensity x FrontalArea x Cd x (GroundSpeed + HeadwindSpeed)2 x GroundSpeed
This formula is revealing, and suggests several things. Firstly, that aero power loss rises extremely rapidly as speed increases (i.e. with the cube of speed). Second, getting into a better position on your bike can have a "double whammy" effect on saving aero power loss, by reducing Frontal Area and improving your Drag Coefficient at the same time. Third, air density matters too, and the difference between a normal low-pressure day (99.4 kPa) and a high-pressure day (101.5 kPa) can be 7 seconds around Richmond Park's 6.7 miles. Fourth, the weight of rider or bike does not materially come in to it. In fact, weight is completely irrelevant to aero drag at a constant speed. Fifth, it explains why it's so difficult to "lose" someone who's stuck to your back wheel. 2. Climbing Depending on the combination of speed and gradient, Aero Drag and Climbing between them account for the vast majority of energy drain from a cyclist's Kinetic Energy, and each of these also involves the cyclist feeling a force acting to slow down progress. With aero losses, that force is a drag force, very like someone grabbing your jersey and trying to pull you back. In the case of climbing, as you turn uphill you start to feel the force of gravity acting to slow you down. When you're on the exact flat, that gravity force is still there, it's just at 90 degrees to your direction so has no influence. The bigger the gradient, the more the gravity force is acting against the cyclist's direction of travel, and this is what the cyclist now has to work to overcome (as well as any aero drag there might be). The formula for the climbing power loss is: climbing power loss = Mass x 9.807 x Sine(ClimbAngle) x Velocity
This also is interesting. There are no diminishing returns at work as with the aero formula, i.e. climbing power simply doubles with twice the speed. Also, (obviously) weight does matter when climbing. Although it's worth bearing in mind when considering that extra kilogram, for power considerations it's not a kilogram on the bike, it's a kilogram on bike-and-rider, far more marginal. 3. Rolling Resistance Rolling Resistance occurs because at the tyre/road interface, aka the "contact patch", the tyre is actually flat on the road over a small area. Around the rest of the tyre, the tyre has resumed its more-or-less circular cross-section. This means that at the leading- and trailing-edge of that contact patch, rubber is being deformed and reformed between smooth cross-section and sharp deflection at the road surface. This rubber deformation requires energy and creates heat. Higher tyre pressures tend to reduce the deformation and reduce the power drain. In the physics, this is captured in a quantity called "Coefficient of Rolling Resistance" (CRR), using the following formula: rolling resistance loss = Mass x 9.807 x CRR x Cosine(ClimbAngle) x Velocity
A typical value of CRR for a road tyre inflated to 120psi might be 0.003, and as such Rolling Resistance, although always there, tends to account for only a few percent of whatever power is being lost when a cyclist is working hard, and is therefore a little sister to aero and climbing. 4. Bearing Friction Bearing Friction, in the hubs, bottom-bracket and pedal bearings, for a properly maintained bike, is an even littler sister than RR, and is estimated by the experimentally-determined formula: bearing resistance loss = 0.001 x Velocity x (91 + (8.7 x Velocity))
A 75kg rider on an 8kg bike at 25mph will lose 2.1W to bearing resistance according to this formula. Very small, but just large enough to need taking account of. 5. Transmission Losses You, the rider, are sitting on your bike producing Power. The whole system is receiving and responding to that power via a chain-drive mechanism between teeth on the chainring and teeth at the rear sprockets. This arrangement is often clogged up with black oily grit-grease mix, and at worst the chain might even be rusty and squeak! For a reasonably well-maintained race-level machine, I am reliably informed that a good estimate for how efficient this arrangement is, is that 2.5% of the cyclist's power will be lost. In other words 97.5% of your power will be available to overcome all the losses described above. For the purpose of the mathematics, the cyclist's power output will simply be reduced by that amount. |
||||||||||||||||||||||||||||||||||||||||||||||||||||||||||||||||||||||||||||||||||||||||||||||||||||||||||||||||||||||||||||||||||||||||||||||||||||||||||||||||||||||||||||||||||||||||||||||||||||||||||||||||||||||||||||||||||||||||||||||||||||||||||||||||||||||||||||||||||||||||||||||||||||||||||||||||||||||||||||||||||||||||||||||||||||||||||||||||||||||||||||||||||||||||||||||||||||||||||||||||||||||||||||||||||||||||||||||||||||||||||||||||||||||||||||||||||||||||||||||||||||||||||||||||||||||||||||||||||||||||||||||||||
|
SlidingSeat.net / Magnus Burbanks / member of Molesey Boat Club, UK
|
||||||||||||||||||||||||||||||||||||||||||||||||||||||||||||||||||||||||||||||||||||||||||||||||||||||||||||||||||||||||||||||||||||||||||||||||||||||||||||||||||||||||||||||||||||||||||||||||||||||||||||||||||||||||||||||||||||||||||||||||||||||||||||||||||||||||||||||||||||||||||||||||||||||||||||||||||||||||||||||||||||||||||||||||||||||||||||||||||||||||||||||||||||||||||||||||||||||||||||||||||||||||||||||||||||||||||||||||||||||||||||||||||||||||||||||||||||||||||||||||||||||||||||||||||||||||||||||||||||||||||||||||||
|
|
|
My fascination with cycling as well as rowing, and applying the same quantitative thinking. People get religious about how to keep the drivetrain clean. Here's my gospel. We all get punctures, and hate them. A quick exposé on how and why they happen, and how to dramatically reduce their frequency. Richmond Park, 10.7km of roadies' heaven, its hills and my process of mapping its gradients every few ten metres. Using the mathematical model to simulate a ride round Richmond Park's 10.7km road circuit and hills, I present some tables
to either predict your time around the Park, or judge a time already done: for different
positions e.g. on the brake hoods or tri-bars; or for various combinations of power
and weight Common responses to simulated times are: "how on earth...?" and simple disbelief. Here I describe how it gets done, judge for yourself. Brief outline of the physics and equations involved in riding a road bike, with some discussion of the implications. Obviously wind makes a tremendous difference to TT speed. And not just its strength, but also its direction. Next up I'll
present simulation results showing Richmond Park predicted times for different strengths and directions of wind. Quick question: for a given power, will your
fastest time around the Park be windy or windless? |